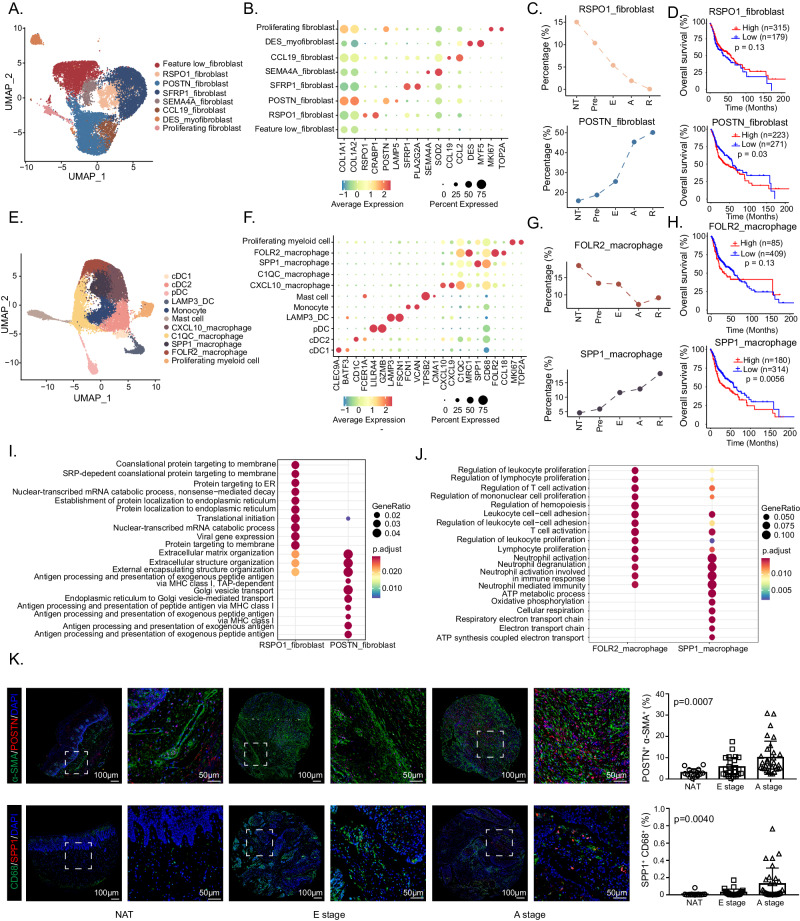
Fig. 3. Characterization of fibroblasts and myeloid cells during HNSCC progression.
UMAP plots show the composition of 15291 fibroblasts (A) and 20306 myeloid cells (E) from 26 samples. Dot plots show the expression of common marker genes as well as top 2 most variable genes across each fibroblast (B) and myeloid cell (F) subset. (C) The infiltration proportion of RSPO1+ fibroblasts (above) and POSTN+ fibroblasts (below). D The Kaplan-Meier overall survival curves of TCGA-HNSCC patients stratified by RSPO1+ fibroblasts (above) and POSTN+ fibroblasts (below) infiltration, n = 494. G The infiltration proportion of FOLR2+ macrophages (above) and SPP1+ macrophages (below). H The Kaplan-Meier overall survival curves of HNSCC patients stratified by FOLR2+ macrophages (above) and SPP1+ macrophages (below) infiltration, n = 494. I Bubble plot shows comparison of DEG enrichment GO terms between RSPO1+ fibroblasts and POSTN+ fibroblasts. (J) Bubble plot shows comparison of DEG enrichment GO terms between FOLR2+ macrophages and SPP1+ macrophages. K Representative images of mIHC staining of POSTN+ fibroblasts (POSTN+ α-SMA+ double positive) and SPP1+ macrophages (SPP1+ CD68+ double positive) in HNSCC tumor and nonmalignant samples. Scale bar = 50 μm. The quantitative results are shown on the right. n = 70 for POSTN+ fibroblasts, n = 68 for SPP1+ macrophages. Data represent mean ± SD. P values were calculated by two-sided Wilcoxon signed-rank test in I and J, by one-way ANOVA test in K, and by two-sided log-rank test in D and H. Source data are provided as a Source Data Fig. 3A–K.

