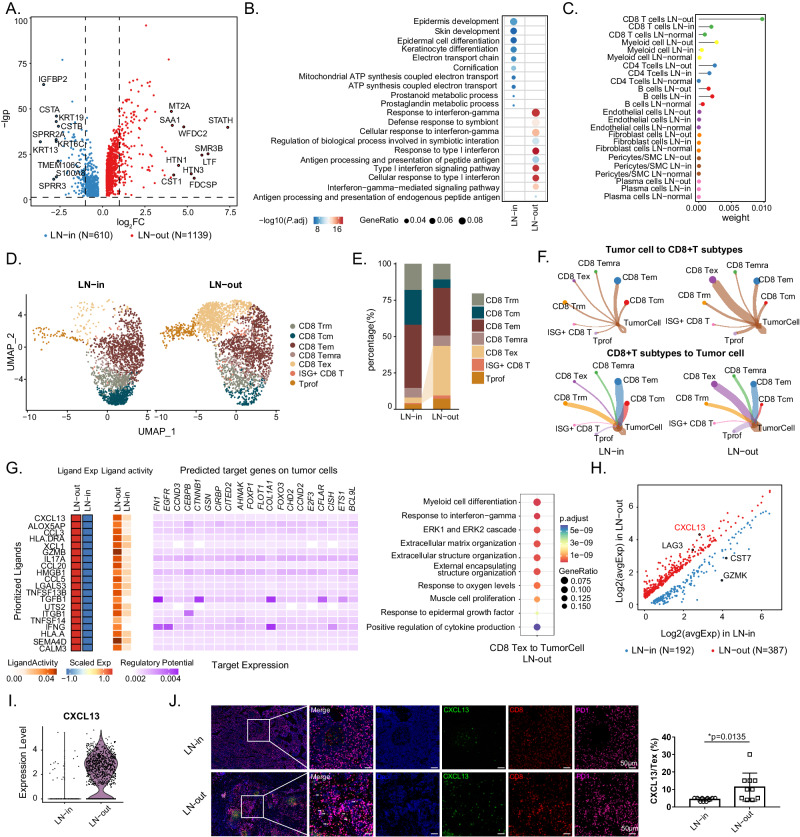
Fig. 5. Tumor cell reprogramming by exhausted CD8+ T during extracapsular metastasis.
A Volcano plot shows DEGs in malignant epithelial cells in LN-out (1139 genes up-regulated) and LN-in (610 genes up-regulated) samples. B Bubble chart shows the enrichment of specific pathways, based on the HALLMARK gene set of upregulated genes, in LN-out and LN-in malignant epithelial cells. C Comparison of interaction strength between different cells in LN-out, LN-in, and LN-normal samples. D UMAP plot shows 2079 CD8+ T cells from 3 LN-in samples and 2878 CD8+ T cells from 2 LN-out samples. E Bar plot shows the proportion differences of CD8+ T cell subclusters between LN-out and LN-in samples. F Circle plots show cell-cell interaction strength differences of tumor cells and CD8+ T cell subclusters in LN-out and LN-in samples. G Heatmap of Nichenet analysis shows regulatory patterns of CD8 Tex cells to tumor cells. Representative GO and KEGG pathways enrichment of the predicted target genes expressed in tumor cells are exhibited in the right. Volcano plot (H) and violin plot (I) show DEGs in CD8 Tex in LN-out (387 genes up-regulated) and LN-in (192 genes up-regulated) samples. J Representative mIHC staining of lymph node samples. Dapi (blue), CXCL13 (green), CD8 (red), PD1 (purple), in individual and merged channels are shown. Scale bar = 50 μm. Proportion of CXCL13+ Tex is compared between LN-in and LN-out samples and is shown in the right (n = 10 for each group). Data represent mean ± SD. P values were calculated by two-side Student’s t-test in J, and by two-sided Wilcoxon signed-rank test in A, B, G, and H. Source data are provided as a Source Data Fig. 5A-J.

