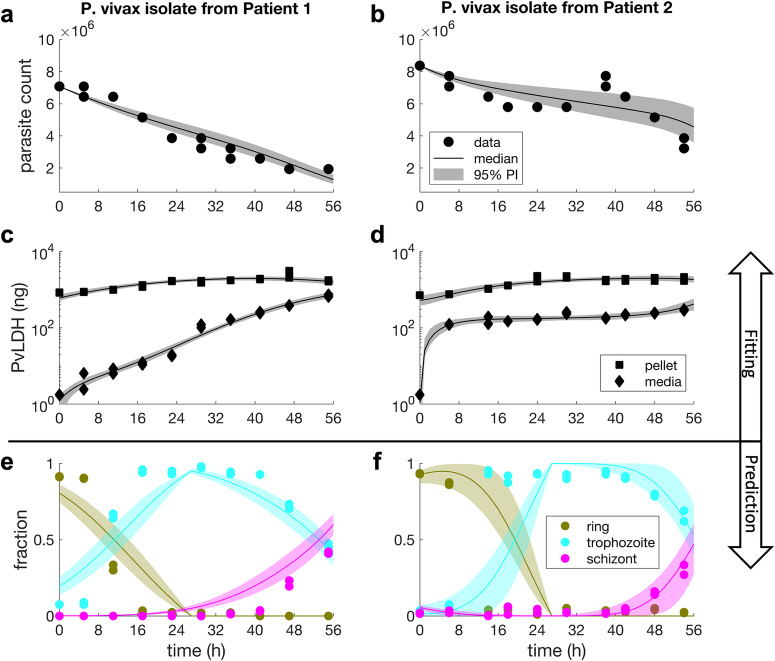
Fig. 1. Results of ex vivo model fitting and model predictions.
Panel a–d show the results of fitting the ex vivo model to the culture data of P. vivax isolates from two malaria patients in Timika, Indonesia. The solid dots are experimental measurements of parasite counts in the cultures and the solid squares and diamonds are experimental measurements of PvLDH in the culture pellet and media, respectively (note that PvLDH concentrations were measured and then converted to mass based on the volume of the culture; see Methods for details). Model fits are shown by the median and 95% prediction interval (PI) of the model-predicted distributions of parasite count and PvLDH levels (in nanogram) at different time points (in hours). The calculation of the median and the 95% PI is described in the Methods. Panel e and f show the model-predicted fractions of parasites at different stages of the lifecycle, which are shown by the median predictions (colour curves) and associated 95% PIs. Experimental measurements of the fractions of rings, trophozoites and schizonts are also shown in the figures for comparison (solid-coloured dots). Experimental measurements were conducted in duplicate at each timepoint.

