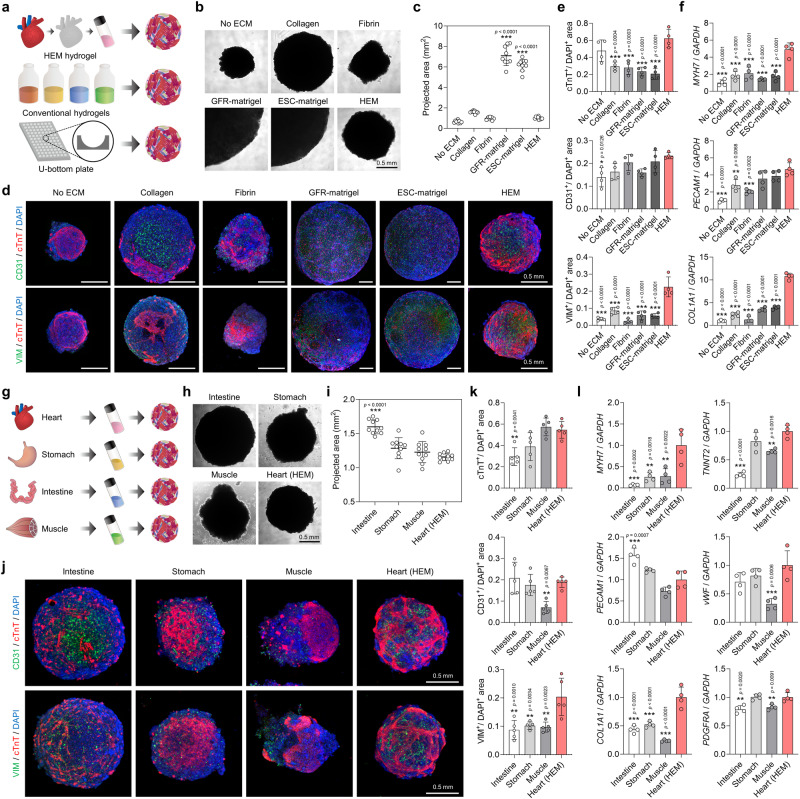
Fig. 2. Heart extracellular matrix (HEM) hydrogel is superior to conventional methods for fabricating human cardiac tissues.
a Schematic illustrations of the fabrication of cardiac tissues using HEM hydrogel, conventional commercial hydrogels, or U-bottom plates. b Bright-field images and c projected areas of human cardiac tissues fabricated using U-bottom plates (No ECM [extracellular matrix]), collagen, fibrin, growth factor reduced (GFR)-Matrigel, embryonic stem cell (ESC)-qualified Matrigel, and HEM hydrogel (scale bar = 0.5 mm, N = 9, biological replicates, ***p < 0.001 versus HEM group). d Representative immunofluorescent images and e quantification of the areas positive for cardiomyocyte (CM; cTnT), endothelial cell (EC; CD31), and cardiac fibroblast (CF; VIM) markers in each group of cardiac tissues (scale bars = 0.5 mm, N = 4, biological replicates, *p < 0.05 and ***p < 0.001 versus HEM). The cTnT-positive areas were quantified using immunofluorescent images in (d). f Quantitative PCR (qPCR) analysis of relative mRNA expression levels of CM (MYH7), EC (PECAM1), and CF (COL1A1) markers in each group of cardiac tissues (N = 4, biological replicates, **p < 0.01 and ***p < 0.001 versus HEM group). g Schematic illustrations of fabrication of cardiac tissues using HEM hydrogel and other tissue-derived ECM hydrogels. h Bright-field images and i projected areas of cardiac tissues fabricated using decellularized intestine, stomach, and muscle-derived ECM hydrogels and HEM hydrogel (scale bar = 0.5 mm, N = 10, biological replicates, ***p < 0.001 versus HEM group). j Representative immunofluorescent images and k quantification of the areas positive for CM (cTnT), EC (CD31), and CF (VIM) markers in each group of cardiac tissues (scale bars = 0.5 mm, N = 5, biological replicates, **p < 0.01 versus HEM group). The cTnT-positive areas were quantified using immunofluorescent images in (j). l qPCR analysis of relative mRNA expression levels of CM (MYH7 and TNNT2), EC (PECAM1 and vWF), and CF (COL1A1 and PDGFRA) markers in each group of cardiac tissues (N = 4, biological replicates, **p < 0.01 and ***p < 0.001 versus HEM group). Cardiac tissues prepared with human induced pluripotent stem cell (hiPSC)-derived CMs, CFs, and human umbilical vein endothelial cells (HUVECs) were cultured for 7 days and used for analysis. Data are presented as means ± S.D. Statistical significance was determined using one-way ANOVA with Tukey’s multiple comparisons tests in (c, e, f, i, k, and l).

