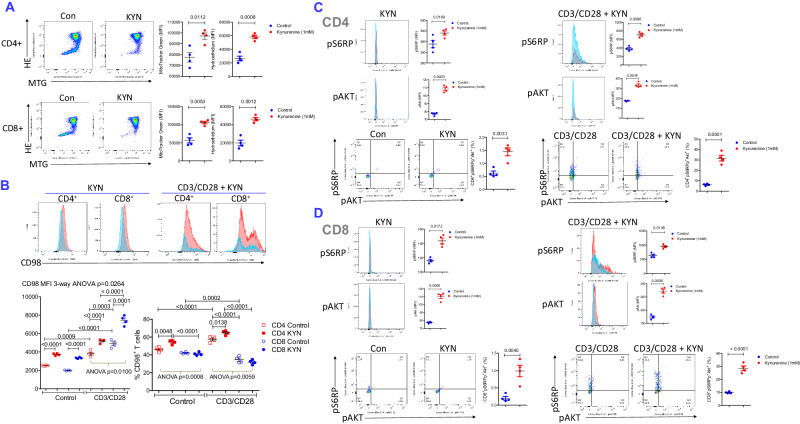
Fig. 6. Contrasting effects of KYN on activation of mTORC1 and mTORC2, expression of CD98 and relative abundance of primary CD4+ and CD8 mouse T+ cells.
Splenocytes from four female B6 mice were stimulated with 1 mM KYN alone or together with CD3/CD28 for 72 h in vitro, as indicated for each panel. Phenotyping for expression of CD3, CD19, CD4, CD8, and CD98 was performed by flow cytometry. A Measurement of mitochondrial mass and ROS production by MTG and HE fluorescence, respectively. Left panels show representative flow cytometry dot plots, while right panels show GraphPad charts of cumulative analyses. Brackets represent p values < 0.05 by comparison using two-tailed paired t test. The number of mice was n = 4 in each experimental group. Charts show mean ± SEM for each experimental group. B Effect of KYN on the expression of CD98 and the prevalence of CD4+ and CD8+ T cells with and without concurrent CD3/CD28 co-stimulation. Representative flow cytometry histograms and dot plots and mean ± SE four independent experiments are shown. Brackets show p values < 0.05 using 3-way ANOVA and Sidak’s post-hoc tests to correct for multiple comparisons. CD98MFI three-way ANOVA p = 0.0264; Sidak’s post-hoc test p values corrected for multiple comparisons: KYN vs control unstimulated CD4+ T cells p < 0.0001, KYN vs control unstimulated CD8+ T cells p < 0.0001, KYN vs control CD3CD28-stimulated CD4+ T cells p < 0.0001, KYN vs control CD3CD28-stimulated CD8+ T cells p < 0.0001, CD3CD28-stimulated vs unstimulated CD4+ T cells p = 0.0009, CD3CD28-stimulated vs unstimulated CD8+ T cells p < 0.0001, control CD3CD28-stimulated CD4+ vs control CD3CD28-stimulated CD8+ T cells p = 0.0003, KYN-treated CD3CD28-stimulated CD4+ vs KYN-treated CD3CD28-stimulated CD8+ T cells p < 0.0001. Two-way ANOVA of CD3CD28-stimulated control and KYN-treated CD4+ and CD8+ T cells p = 0.0100. %CD98+ cells three-way ANOVA p = 0.6602; Sidak’s post-hoc test p values corrected for multiple comparisons: KYN vs control unstimulated CD4+ T cells p = 0.0048, KYN-treated unstimulated CD4+ T cells vs KYN-treated unstimulated CD8+ T cells p < 0.0001,KYN vs control CD3CD28-stimulated CD4+ T cells p = 0.0138, CD3CD28-stimulated vs unstimulated CD4+ T cells p < 0.0001, CD3CD28-stimulated vs unstimulated CD8+ T cells p = 0.0002, control CD3CD28-stimulated CD4+ vs control CD3CD28-stimulated CD8+ T cells p < 0.0001, KYN-treated CD3CD28-stimulated CD4+ vs KYN-treated CD3CD28-stimulated CD8+ T cells p < 0.0001. Two-way ANOVA of unstimulated control and KYN-treated CD4+ and CD8+ T cells p = 0.0008. Two-way ANOVA of CD3CD28-stimulated control and KYN-treated CD4+ and CD8+ T cells p = 0.0059. C Effect of KYN on mTORC1 and mTORC2 activities in CD8+ T cells with and without concurrent CD3/CD28 co-stimulation. Following staining for surface expression of CD3, CD19, CD4, CD8, and CD98, cells were fixed and permeabilized and activities of mTORC1 and mTORC2 were measured by intracellular staining for pS6RP and pAkt, respectively. Representative flow cytometry histograms and dot plots and mean ± SE four independent experiments are shown. Brackets represent p values < 0.05 by comparison using two-tailed paired t-test: KYN-treated vs control unstimulated cells pS6RP MFI p = 0.0169, pAkt MFI p = 0.0003, CD4+pS6RP+pAkt+ (%) p = 0.0031, KYN-treated vs control CD3CD28-stimulated cells pS6RP MFI p = 0.0086, pAkt MFI p = 0.0018, CD4+pS6RP+pAkt+ (%) p = 0.0001. D Effect of KYN on mTORC1 and mTORC2 activities in CD8+ T cells with and without concurrent CD3/CD28 co-stimulation. Following staining for surface expression of CD3, CD19, CD4, CD8, and CD98, cells were fixed and permeabilized and activities of mTORC1 and mTORC2 were measured by intracellular staining for pS6RP and pAkt, respectively. Representative flow cytometry histograms and dot plots and mean ± SE four independent experiments are shown. Brackets represent p values < 0.05 by comparison using two-tailed paired t test: KYN-treated vs control unstimulated cells pS6RP MFI p = 0.0172, pAkt MFI p = 0.0005, CD8+pS6RP+pAkt+ (%) p = 0.0040, KYN-treated vs control CD3CD28-stimulated cells pS6RP MFI p = 0.0136, pAkt MFI p = 0.0006, CD8+pS6RP+pAkt+ (%) p < 0.0001.

