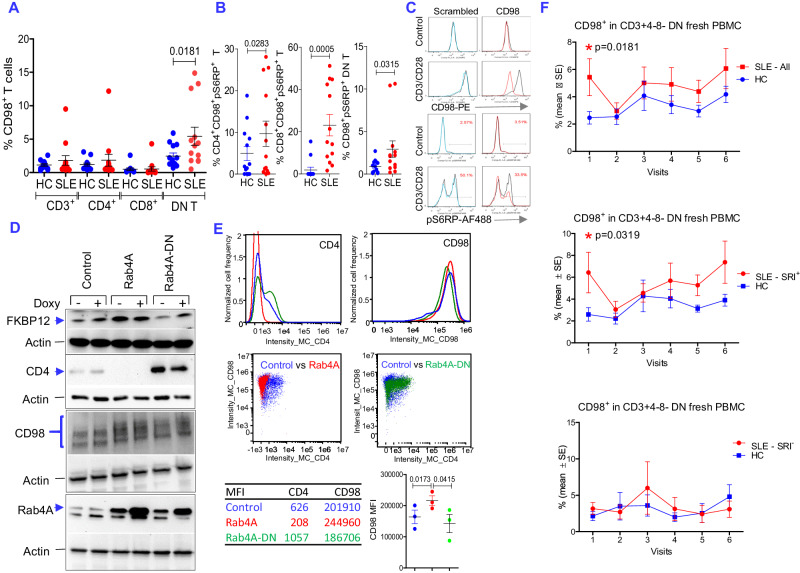
Fig. 9. CD98 expression promotes mTOR activation and predicts clinical response to sirolimus in patients with SLE.
A Quantitation of CD98+ T cells in 12 paired SLE and healthy control (HC) participants; two-tailed t test p = 0.0181. Charts show mean ± SEM for each experimental group. B mTORC1 activation is increased within CD98+ T lymphocytes in 12 SLE patients relative to 12 HC participants. Charts show mean ± SEM for each experimental group. p values < 0.05 are shown as determined by 2-tailed paired t-test. C Knockdown by siRNA indicates CD98 involvement in TCR-induced mTOR activation. Alexa647-conjugated CD98 or scrambled control siRNA was electroporated into 2 × 10⁶ HC peripheral blood lymphocytes (PBL), as earlier described6,35. CD98PE and pS6RP-AF488 histograms were gated on Alexa 647+/CD3-APC-Cy7+ dual-positive cells. mTORC1 activation was assessed by the bracketed pS6RP-AF488+ cells, as earlier described19,102. D Rab4A promotes the surface expression of CD98. The effect of Rab4A was examined by western blot on the expression of FKBP12 and CD98 in Jurkat cells carrying doxycycline-inducible adeno-associated virus (AAV) expression vectors27. Western blots represent 5 or more similar experiments. Jurkat cells with construct 6678 overexpressed wild-type Rab4A while those with construct 9035 overexpressed dominant-negative Rab4AS26N (Rab4A-DN), as earlier described27. Control cells carried “empty“ vector construct 448027. Rab4A, FKBP12, CD4, and actin were detected by antibodies described earlier6. CD98 was detected with antibody sc-9160 from Santa Cruz Biotechnology (Santa Cruz, CA). E Effect of Rab4A on surface expression of CD98 was detected by flow cytometry. CD4 was detected as a control antigen that is targeted for lysosomal degradation by Rab4A, which is blocked by overexpression of Rab4A-DN27. Of note, the expression vectors confer moderate overexpression of Rab4A and Rab4A-DN in the absence of doxycycline, which are sufficient to exert opposing changes on CD4 expression in Jurkat cells of primary CD4 T cells, as earlier described27. Top and middle panels show histogram and dot plot overlays of CD4 and CD98 expression. Bottom panels show mean channel fluorescence intensity (MFI) of representative histograms of the top panel, while bar charts show mean ± SE of three independent experiments. P values represent comparison using two-tailed paired t test, connecting bars indicate P < 0.05, which reflect hypothesis testing and have not been corrected for multiple comparisons. F Effect of sirolimus (rapamycin) treatment on expression of CD98 in DN T cells in SLE patients during 12-month intervention. The prevalence of CD98+ DN cells was determined in thirteen freshly isolated PBL of SLE and HC participants matched for age within 10 years (top panel). Nine patients met criteria for SLE Responder Index (SRI+, middle panel), while 4 patients were SRI non-responders (SRI−, lowest panel). CD98+ DN cells were assessed before treatment (visit 1) and after treatment for 1 month (visit 2), 3 months (visit 3), 6 months (visit 4), 9 months (visit 5), and 12 months (visit 6). Effects of sirolimus were also assessed by 2-tailed paired t test relative to HC participants tested in parallel; *, p < 0.05. Charts show mean ± SE of patients and controls for each time point.

