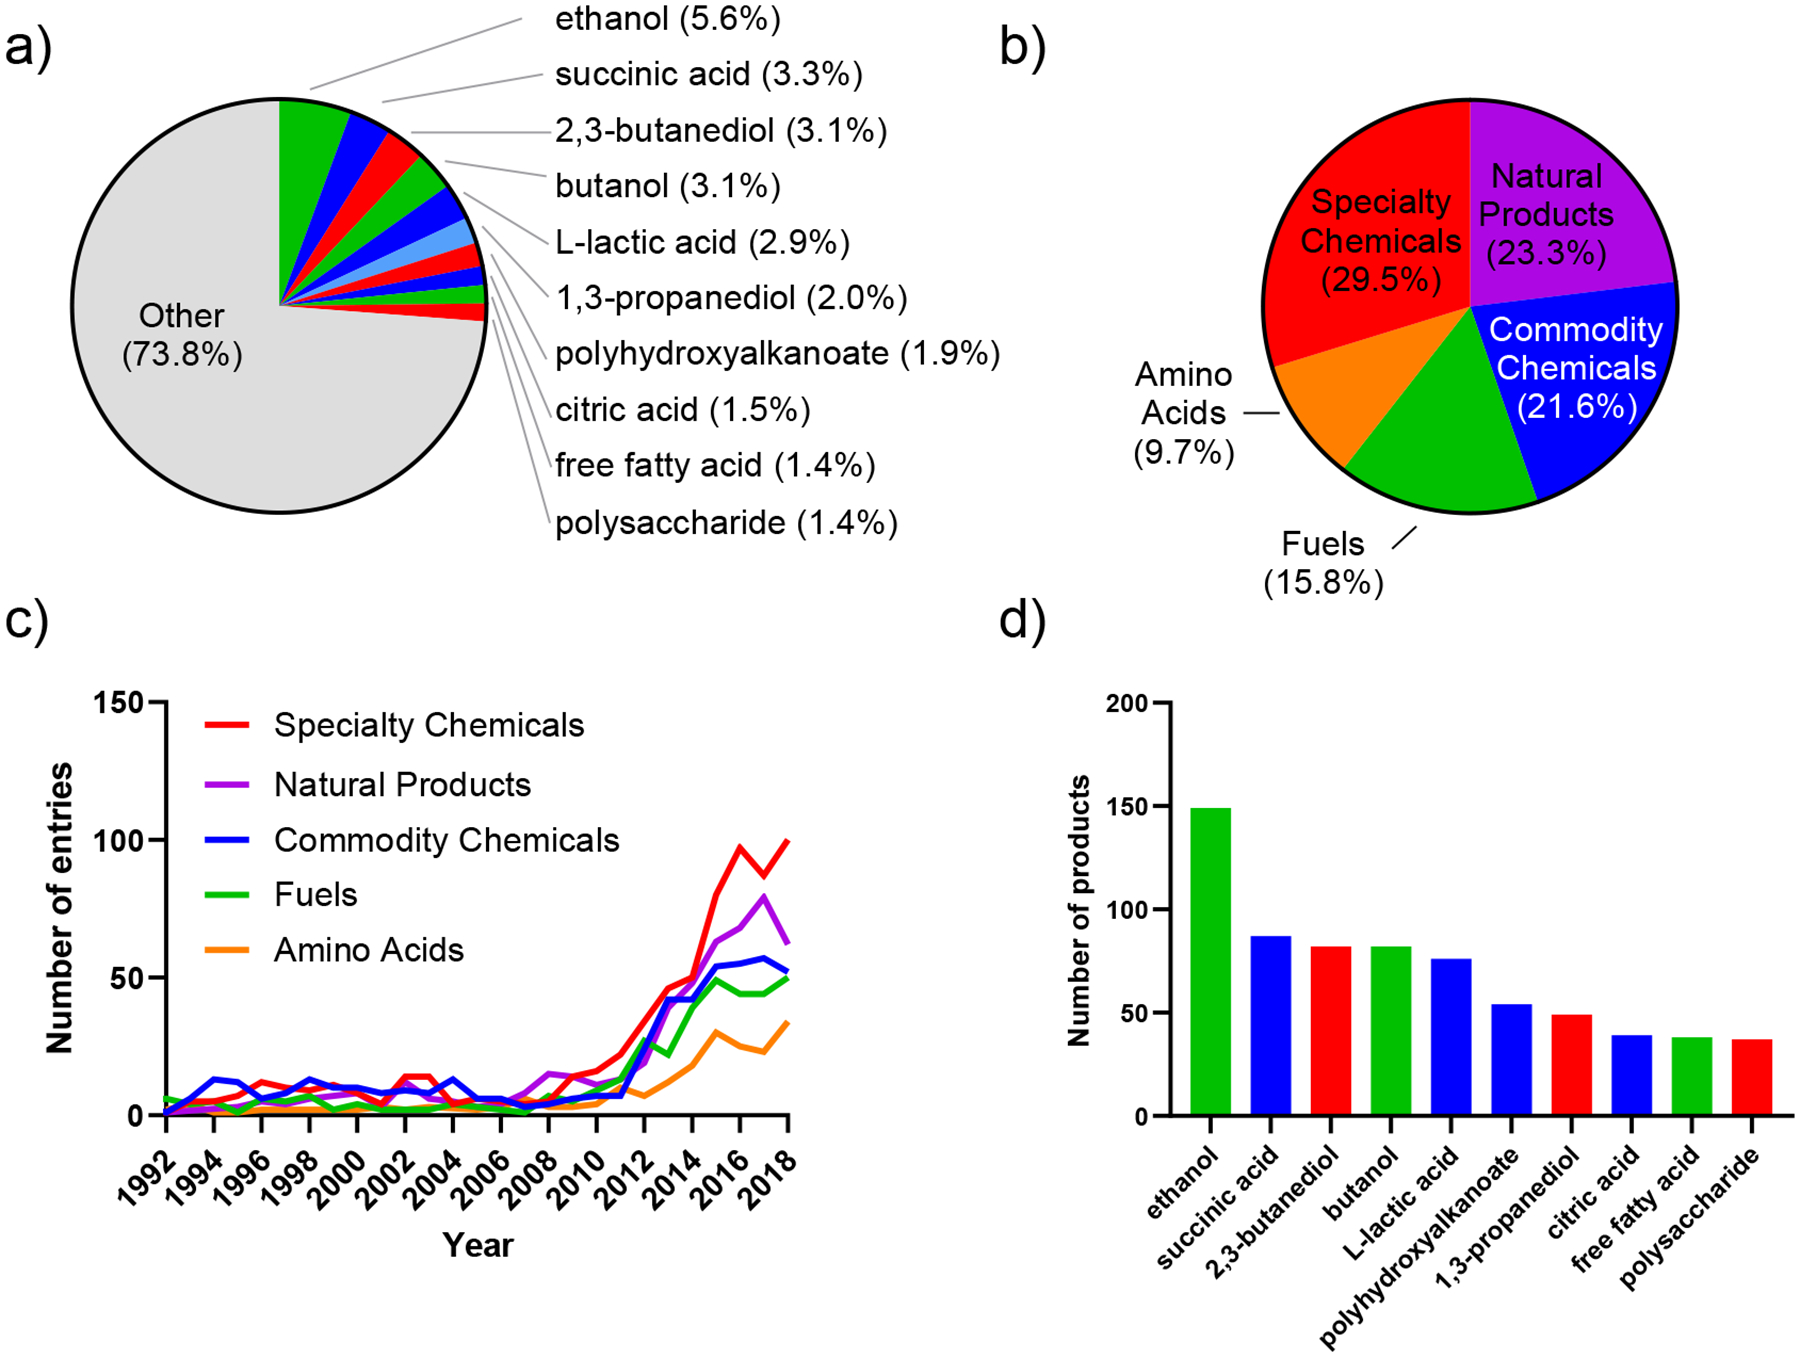
Figure 2. Most produced products ranked by the number of associated entries in the dataset.

(a) Number of entries associated with each product relative to the total number of entries in the dataset (2,644). Only the top ten are shown. (b) Distribution of the number of entries associated with the five major classes of products according to the dataset. (c) Five major classes over time. Data shown from 1992–2018. (d) Absolute number of entries associated with the top ten products. Database is available on our lab website (https://parklab.ucla.edu/resources.html/).
