Figure 3.

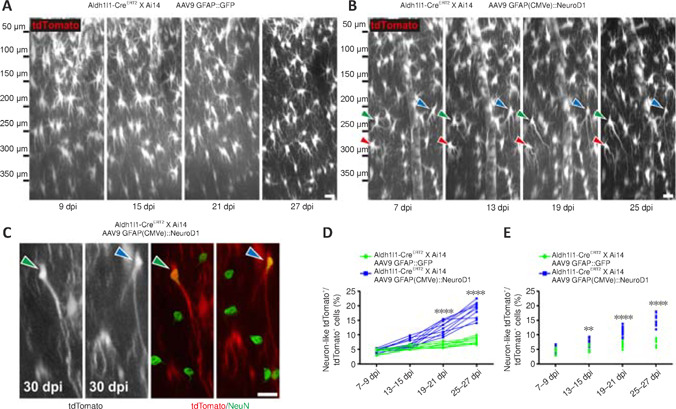
Two-photon imaging of the direct conversion of lineage-traced astrocytes into neurons following AAV-mediated NeuroD1 overexpression in adult lineage-tracing mice.
(A) Two-photon time-lapse images illustrating the lack of morphological or positional changes of tdTomato+ astrocytes in Aldh1l1-CreERT2 X Ai14 mice infected with AAV9 GFAP::GFP. Original Z-stack images were resliced along the X–Z plane to obtain a lateral view of the mouse cortex (pia/top, ventricle/bottom). Scale bar: 20 μm. (B) Two-photon time-lapse images illustrating astrocyte-to-neuron conversion of some tdTomato+ lineage-traced astrocytes (each colored arrowhead points to a specific converting cell) induced by AAV9 GFAP(CMVe)::NeuroD1 in Aldh1l1-CreERT2 X Ai14 mice within 4 weeks of infection. By 19–25 dpi, some converted neurons had retracted many short lamellate branches and projected long, thin axons toward the lateral ventricle. Note that the cells indicated by arrowheads were not the only ones undergoing lineage conversion in these images. Original Z-stack images were resliced along the X–Z plane to obtain a lateral view of the mouse cortex (pia/top, ventricle/bottom). Scale bar: 20 μm. (C) Following two-photon imaging, the mouse brains were fixed and immunostained with the neuronal marker NeuN. Some of the morphologically neuron-like lineage-traced tdTomato+ cells shown in B (green/blue arrowheads) were NeuN+ (green, Alexa Fluor 488) by 30 dpi, confirming their neuronal identities. Scale bar: 20 μm. (D) Quantification of the percentage of morphologically neuron-like tdTomato+ cells among all lineage-traced tdTomato+ cells at different time points after AAV infection. The percentage increased continuously over 19–27 dpi with NeuroD1 overexpression, while the percentage remained statistically unchanged at ~6% with GFP overexpression alone. Two-way analysis of variance followed by Sidak's post hoc test, n = 10 animals, ****P < 0.0001, Ftime (3, 54) = 134.3, Fcolumn factor (1, 18) = 132.2. (E) Quantification of the percentage of NeuN+ tdTomato+ cells among all lineage-traced tdTomato+ cells at different time points after AAV infection. The percentage increased continuously over 13–27 dpi with NeuroD1 overexpression, while the percentage remained statistically unchanged at ~5% with GFP overexpression alone. Two-way analysis of variance followed by Sidak's post hoc test, n = 10 animals, **P < 0.01, ****P < 0.0001, Ftime (3, 54) = 152.6, Fcolumn factor (1, 18) = 78.14. dpi: Day(s) post infection; GFAP: glial fibrillary acidic protein; GFP: green fluorescent protein; NeuroD1: neuronal differentiation 1.
