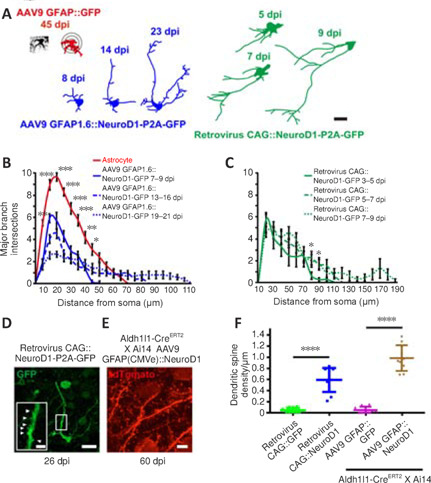
Figure 5.

Neurite outgrowth and dendritic spine development during astrocyte-to-neuron conversion, as observed by two-photon live imaging.
(A) Representative tracings used for Sholl analysis showing the major branches of an AAV9 GFAP::GFP–infected astrocyte (red), a converting cell infected with the CAG::NeuroD1-P2A-GFP retrovirus (green), and an AAV9 GFAP1.6::NeuroD1-P2A-GFP-infected converting cell (blue) at different time points after infection. Note that the processes of NeuroD1-expressing cells adopted a neuron-like morphology over time. Scale bar: 20 μm. (B) Sholl analysis of GFP- (red) or NeuroD1- (blue) overexpressing cells at different time points after AAV infection. Note that many short branches retracted, while a couple of processes grew much longer over time with NeuroD1 overexpression. Two-way repeated-measures repeated-measures analysis of variance with Bonferroni post hoc test, mean ± SEM, n = 20 cells from 5 animals, ***P = 0.0006, Fcolumn factor (3, 76) = 6.59. *P < 0.05; **P < 0.01; ***P < 0.001. (C) Sholl analysis of NeuroD1-overexpressing cells at different time points after retrovirus infection. Note that a couple of processes grew much longer over time with NeuroD1 overexpression. Two-way repeated-measures analysis of variance with Bonferroni post hoc test, mean ± SEM, n = 20 cells from 4 animals, *P = 0.0257, Fcolumn factor (2, 57) = 8.16. *P < 0.05. (D, E) Representative immunostaining images following two-photon live imaging showing many dendritic spines in neurons newly converted from NeuroD1-expressing proliferating astrocytes at 26 dpi (D, arrowheads) or lineage-traced astrocytes at 60 dpi (E). Scale bars: 20 μm, 5 μm (D, inset). (F) Quantification of the dendritic spine density after viral infection. Note that the proliferating cells and lineage-traced cells overexpressing NeuroD1 grew ~0.6 and ~1.0 dendritic spine per μm dendritic shaft length, respectively. Meanwhile, the dendritic spines of proliferating or lineage-traced astrocytes overexpressing GFP alone barely grew. One-way analysis of variance followed by Tukey's post hoc test, mean ± SD, n = 10 animals, ****P < 0.0001, Ftreatment (3, 36) = 33.86. dpi: Day(s) post infection; GFAP: glial fibrillary acidic protein; GFP: green fluorescent protein; NeuroD1: neuronal differentiation 1.
