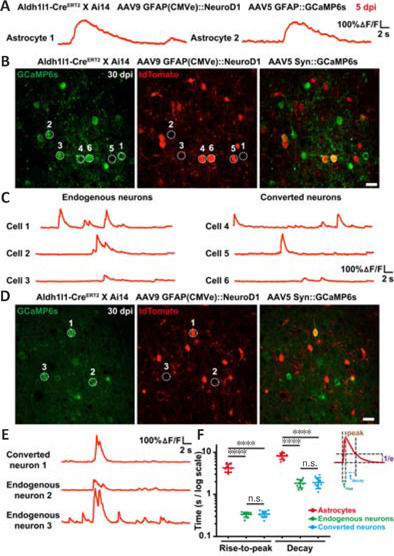
Figure 6.

Functional integration of newly converted neurons into pre-existing neural circuits, as revealed by two-photon Ca2+ imaging in astrocytic lineage-tracing mice.
(A) Representative GCaMP6s traces (in ΔF/F) illustrating spontaneous Ca2+ spikes in tdTomato+ lineage-traced astrocytes (astrocytes 1 and 2) at 5 dpi. Note that the typical widths of the Ca2+ spikes of these astrocytes were significantly broader than those of the neurons. Scale bars: 100% ΔF/F, 2 seconds. (B) Representative frames from two-photon time-lapse Ca2+ imaging of tdTomato+ converted and tdTomato-endogenous neurons with GCaMP6s in Aldh1l1-CreERT2 X Ai14 mice at 30 dpi. Note that all the tdTomato- and tdTomato+ cells we observed expressed GCaMP6s under the control of the neuron-specific synapsin promoter, indicating their neuronal identities. Scale bar: 20 μm. (C) Representative GCaMP6s traces (in ΔF/F) showing spontaneous Ca2+ spikes in endogenous neurons (cells 1–3) and converted neurons (cells 4–6). Note that the amplitude and width of the Ca2+ spikes of the converted neurons were similar to those of the endogenous neurons, suggesting these newly converted neurons were functionally mature at this stage. Scale bars: 100% ΔF/F, 2 seconds. (D) Representative frames from two-photon time-lapse Ca2+ imaging of tdTomato+ converted and tdTomato-endogenous neurons with GCaMP6s in Aldh1l1-CreERT2 X Ai14 mice at 30 dpi. Note that converted neuron 1 and endogenous neurons 2 and 3 were in close vicinity to each other, perhaps within the same neural circuits. Scale bar: 20 μm. (E) Representative GCaMP6s traces (in ΔF/F) showing synchronized Ca2+ spikes among the newly converted (cell 1) and endogenous (cells 2, 3) neurons. These highly synchronized Ca2+ spikes suggest that some newly generated neurons made effective synaptic connections with surrounding neurons, and thus were functionally integrated into pre-existing neural circuits. Scale bars: 100% ΔF/F, 2 seconds. (F) Quantification of the rise and decay time of somatic Ca2+ transients. Note the much shorter rise-to-peak and decay time in converted neurons (trise-to-peak ≈ 200 ms, tdecay ≈ 2 seconds) compared with astrocytes (trise-to-peak ≈ 3.5 seconds, tdecay ≈ 8 seconds). The rise-to-peak time and decay time are defined as the time required to rise to 100% peak value and to decrease to ~36.8% (1/e) peak value. One-way analysis of variance followed by Tukey's post hoc test, mean ± SD, n = 10 animals, ****P < 0.0001, Ftreatment (5, 54) = 168.4. dpi: Day(s) post infection; GCaMP6s: green fluorescent protein-calmodulin fusion protein 6 sensitive; GFAP: glial fibrillary acidic protein; NeuroD1: neuronal differentiation 1.
