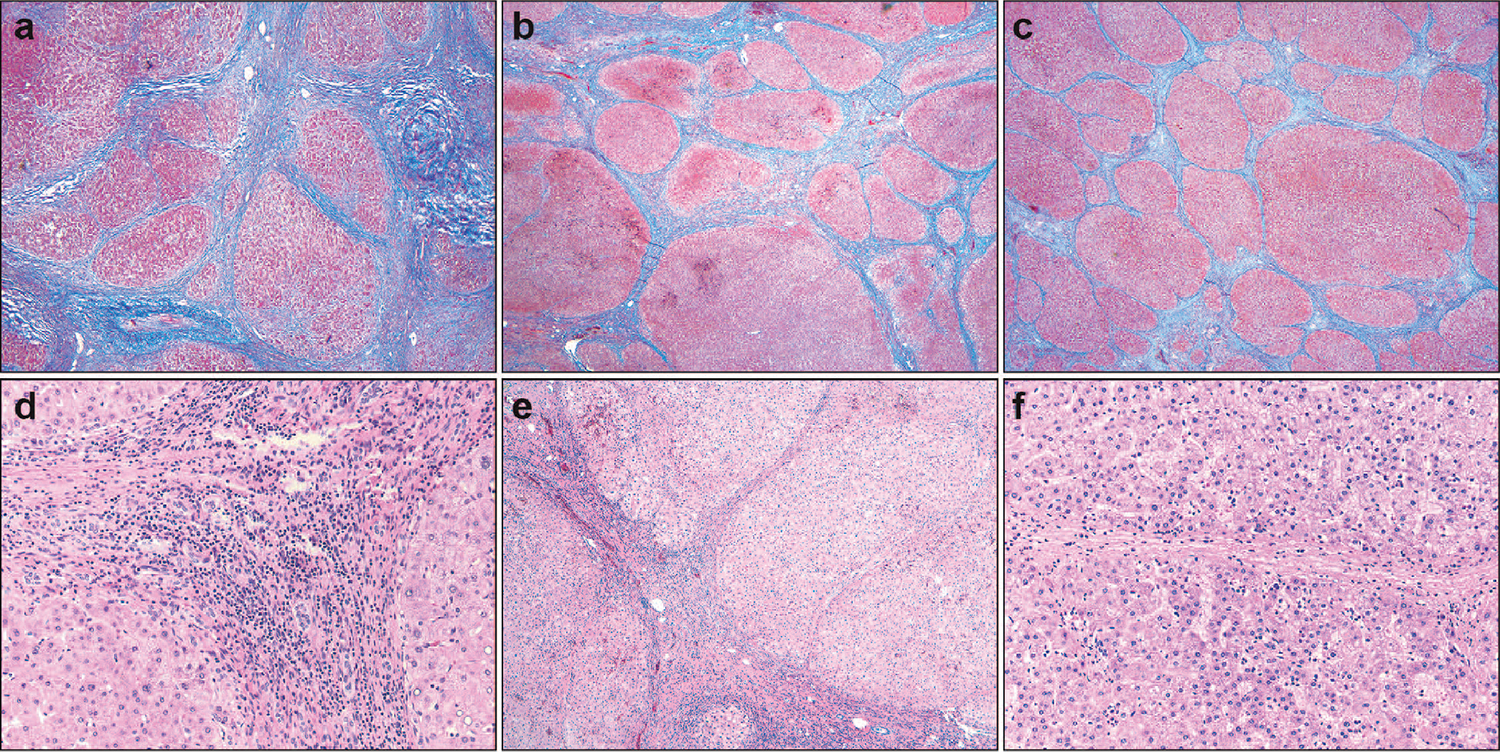
Figure 1.

Representations of progressive-indeterminate-regressive (PIR) scores. a through c, Predominantly progressive (P), indeterminate (I), and regressive (R) fibrosis, respectively. d through f, Higher-power images showing increased thickness, inflammation, and cellularity in progressive septae compared with those undergoing regression (trichrome, original magnification ×40 [a through c]; hematoxylin eosin, original magnifications ×200 [d and f] and ×100 [e]).
