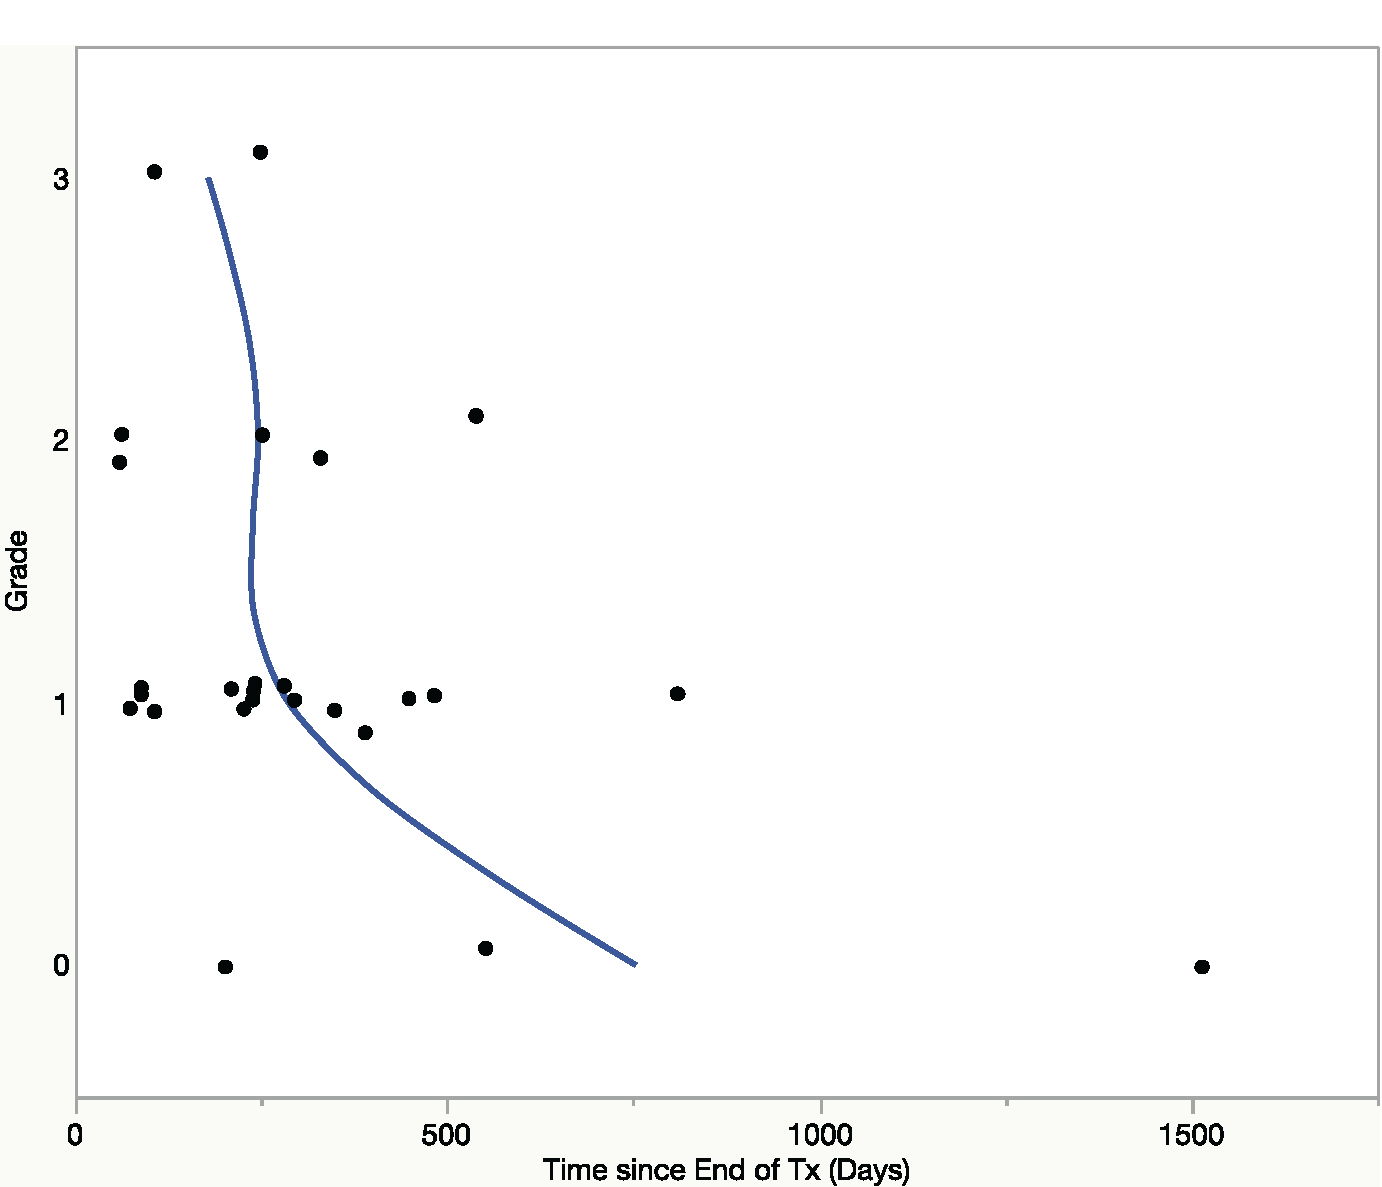
Figure 4.

Inflammatory grade of tissue specimens (y-axis) and time, since treatment cessation, of tissue acquisition (x-axis). There was a trend toward decreased inflammation over time, although by analysis of variance statistic there was no significant difference in the mean time (P = .48) among the 4 categories of inflammation.
