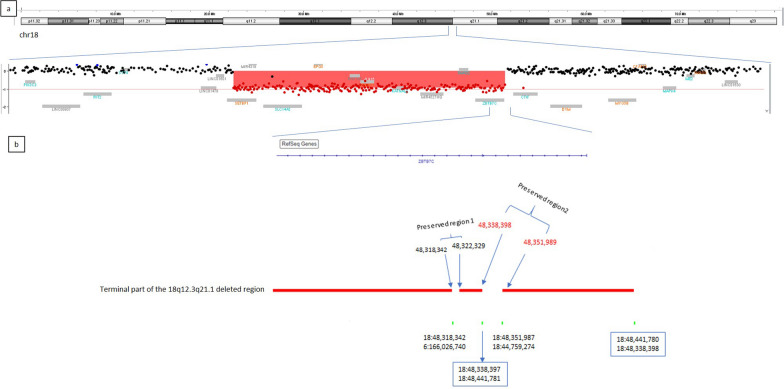
Fig. 6.
Characterization of the 18q12.3q21.1 microdeletion: a array-CGH image showing the deleted region as a downward shift of oligonucleotide probes (red highlighted). The Deletion breakpoints are mapped within between SETBP1 (left) and downstream ZBTB7C. b Enlargement of the microdeletion terminal portion: WGS detecting four further breakpoints and the preservation of two small regions, identified as 1 and 2. Region 1 results to involved in a rearrangement with der(6), while region 2, orientation inverted, represents the unknown genomic material previously detected by OGM. Genomic positions are reported according to GRCh38 assembly

