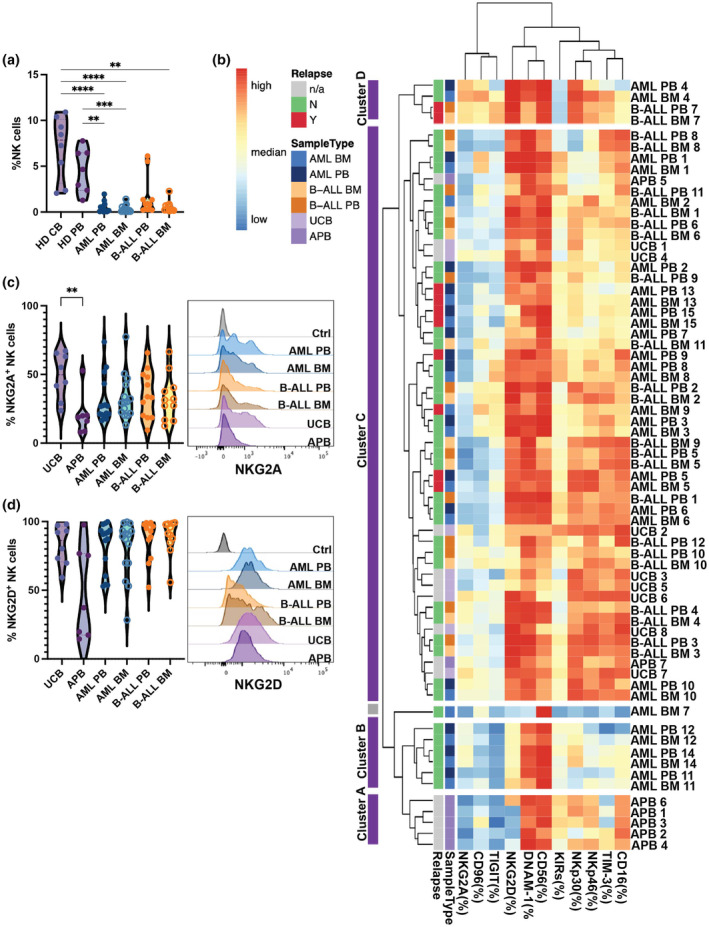
Figure 1.

Low frequencies of NK cells in paediatric leukaemia patients. (a) Percentages of total NK cells in healthy donor umbilical cord blood (UCB; n = 8), healthy donor adult peripheral blood (APB; n = 7), peripheral blood (PB) and bone marrow (BM) of patients with acute myeloid leukaemia (AML; n = 15) or B‐cell acute lymphoblastic leukaemia (B‐ALL; BM: n = 11, PB: n = 12). (b) Hierarchical clustering heatmap display percentage of indicated markers of total NK cells from each donor. Purple clusters are NK cell clusters from different patients. The grey cluster is the non‐NK cell artefact population. (c) and (d) Representative flow cytometry histograms (right) and bar graphs (left) showing the surface expression of NKG2A and NKG2D on NK cells from different donors Data are shown as mean ± sem, data were tested using a Kruskal–Wallis test with Dunn's multiple comparisons test. **P < 0.01, ***P < 0.001, ****P < 0.0001.
