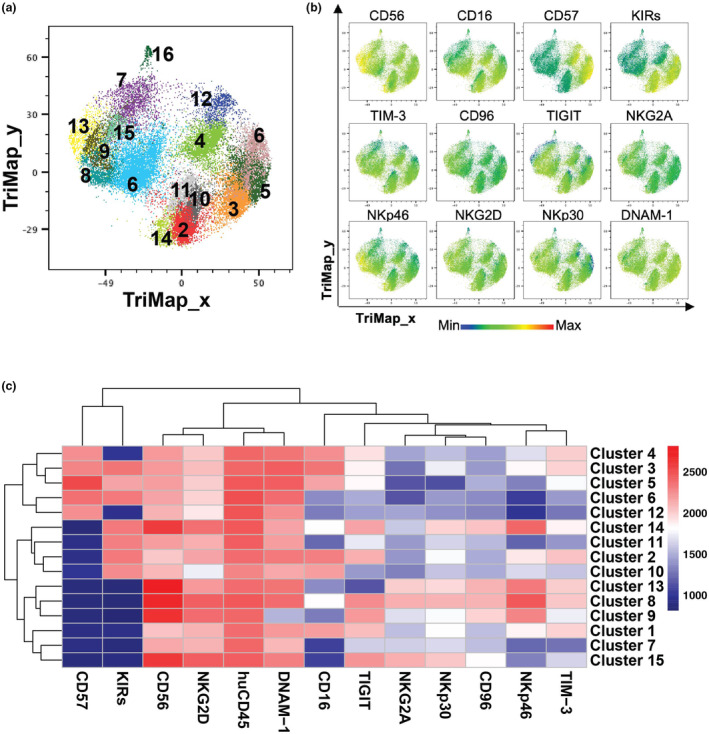
Figure 3.

Fifteen NK cell populations identified in paediatric leukaemia patients. (a) TriMap plots of 15 Phenograph‐identified NK cells from healthy donor umbilical cord blood (UCB; n = 8), healthy donor adult peripheral blood (APB; n = 7), peripheral blood (PB) and bone marrow (BM) of patients with acute myeloid leukaemia (AML; n = 15) or B‐cell acute lymphoblastic leukaemia (B‐ALL; BM: n = 11, PB: n = 12). (b) TriMap plots of total NK cell expression of the indicated markers. (c) Heatmap displays the median fluorescence intensity (MFI) of the indicated markers for each NK cell cluster identified by Phenograph.
