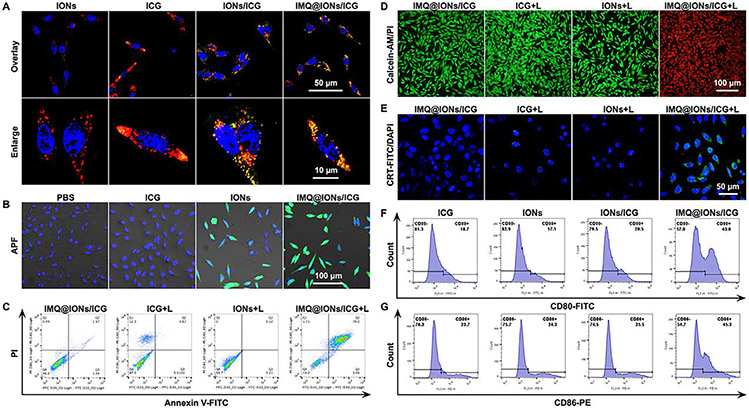
Fig. 2.
Cellular study of IMQ@IONs/ICG with or without laser irradiation. (A) Representative fluorescence images of Panc02-H7 cells showing intracellular uptake of nanoparticles. Blue: DAPI, Red: Lyso-tracker, Green: ICG. (B) Representative fluorescence images of Panc02-H7 cells showing intracellular production of •OH (green) induced by nanoparticles. Blue: DAPI, Green: APF. (C, D) Representative flow scatter plot and fluorescence images showing cell death of Panc02-H7 cells after treatment with IMQ@IONs/ICG plus laser irradiation (0.75 W cm −2, 5 min), with Annexin V-FITC/PI staining (C) or Calcein-AM/PI staining (D). (E) Representative fluorescence images of Panc02-H7 cells showing CRT exposure on the surface after treatment with IMQ@IONs/ICG plus laser irradiation. (F, G) Representative flow graph showing CD80 and CD86 expressions on the surface of DCs stimulated by different nanoparticles.

