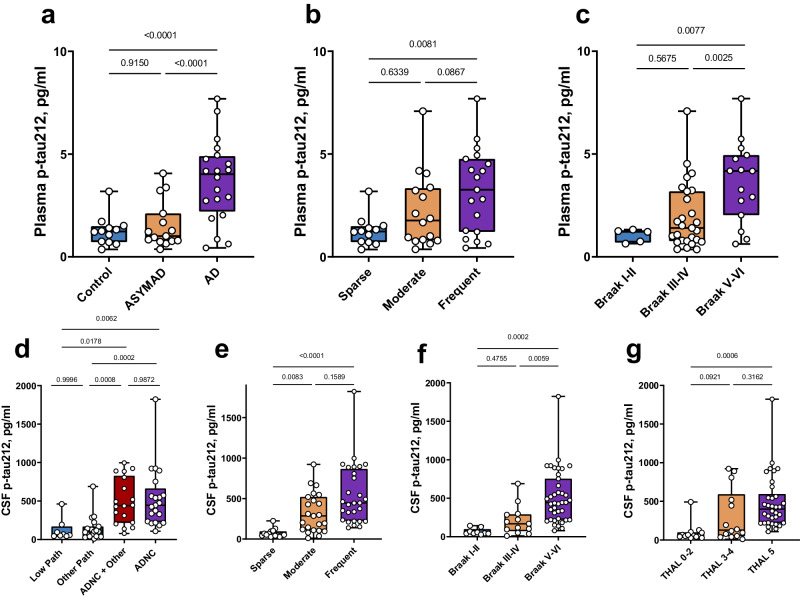
Fig. 5. Clinical performance of plasma and CSF p-tau212 in autopsy verified cohorts.
The figure shows plasma and CSF p-tau212 levels according to diagnostic groups, amyloid pathology, and Braak staging of neurofibrillary tangles in the BLSA- (a-c) and UCSD-neuropathology (d-f) cohorts with post-mortem validation. a Plasma p-tau212 levels in the control (n = 12) ASYMAD (n = 15), and AD (n = 20) groups in the BLSA-neuropathology cohort. b Plasma p-tau212 concentrations according to Aβ plaque counts categorized by the CERAD scoring – Sparse (n = 12), Moderate (n = 16) and Frequent (n = 19). c Stepwise increase of plasma p-tau212 levels according to Braak staging of neurofibrillary tangles - Braak I-II (n = 5), Braak III-IV (n = 27), Braak V-VI (n = 15). d CSF p-tau212 levels according to Alzheimer’s disease neuropathologic change (ADNC) categorization. The groups include those with low ADNC pathology - Low Path (non ADNC) (n = 8), Other Path (n = 19), ADNC (n = 21) and ADNC with concomitant neurodegenerative pathologies (ADNC + Other) (n = 18). e CSF p-tau212 concentrations according to the CERAD scores of Aβ plaques Sparse (n = 15), Moderate (n = 23), Frequent (n = 28) f CSF p-tau212 levels separated based on Braak staging characterization given at autopsy - Braak I-II (n = 9), Braak III-IV (n = 13), Braak V-VI (n = 39). g CSF p-tau212 concentration across different Thal phases - THAL 0-2 (n = 13), THAL 3-4 (n = 14); THAL 5 (n = 34). The estimated mean between-group fold differences of CSF/plasma p-tau212 for every plot are given in Tables 2, 3, and Supplementary Table 10. Comparisons of the performances of p-tau212 with p-tau217, p-tau181 and p-tau231 are shown in Tables 2, 3, and Supplementary Table 10. Boxplots showing measurements of other p-tau biomarkers are shown in Supplementary Fig. 6. Box plots are shown as median and interquartile range (IQR), boundaries of the whiskers are minimum and maximum values. Analysis of variance (ANOVA) with Tukey’s post-hoc test was used to compare differences between groups, after adjusting for sex, age, and CSF/plasma collection-to-death intervals. Pairwise comparisons were adjusted for multiple comparisons. Source data are provided as a Source Data file.

