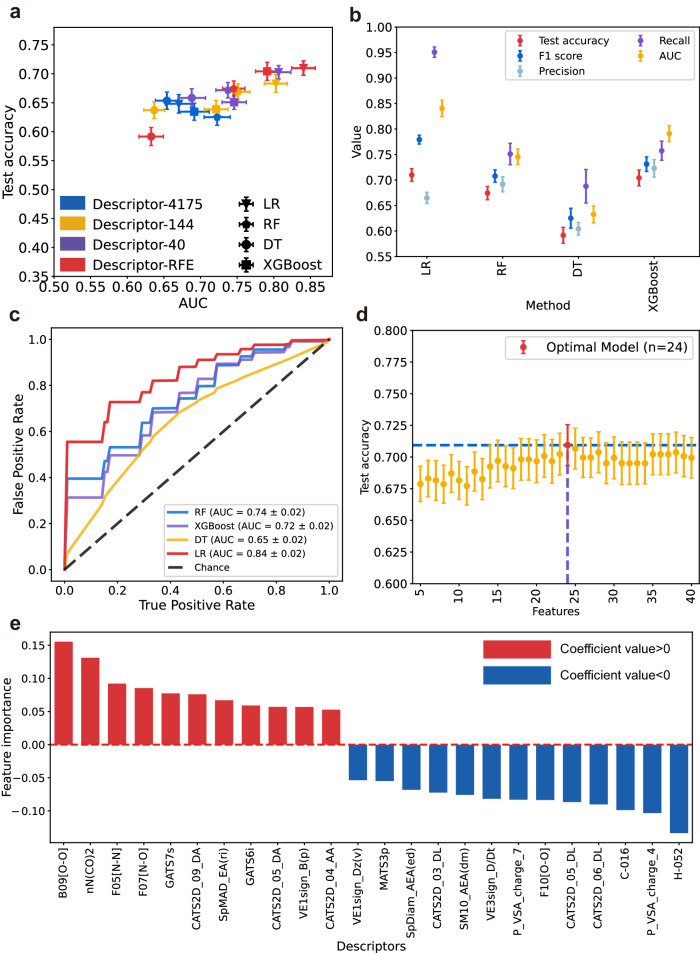
Fig. 3. Evaluation indexes of different models and feature importance of optimal models.
a A scatterplot showed the distribution of AUC (area under the curve) and test accuracy for all models. The 4-point shapes represent different ML algorithms: extreme gradient boosting (XGBoost), logistic regression (LR), decision tree (DT), and random forest (RF). Descriptor’s part: Initially obtained 4175 descriptors,144 descriptors after rank sum test, 40 descriptors after correlation coefficient selection, and descriptors after recursive feature elimination (RFE). The optimal number of descriptors for RFE of each machine learning (ML) algorithm is different (XGBoost, n = 16; LR, n = 24; DT, n = 30; RF, n = 37), data are mean values ± standard error of the mean (SEM). b Evaluation indexes of four algorithms using descriptors after RFE. Combining the results of test accuracy, F1 score and AUC, data are mean values ± SEM. c Receiver operating characteristic curve for the four algorithms (LR, DT, RF, and XGBoost) using descriptors after RFE. d The RFE results of the LR models based on different descriptors within the 40 descriptors, indicated that LR with 24 descriptors had the best performance, data are mean values ± SEM. e The results of feature importance of 24 descriptors for the optimal LR model based on the regression coefficients.

