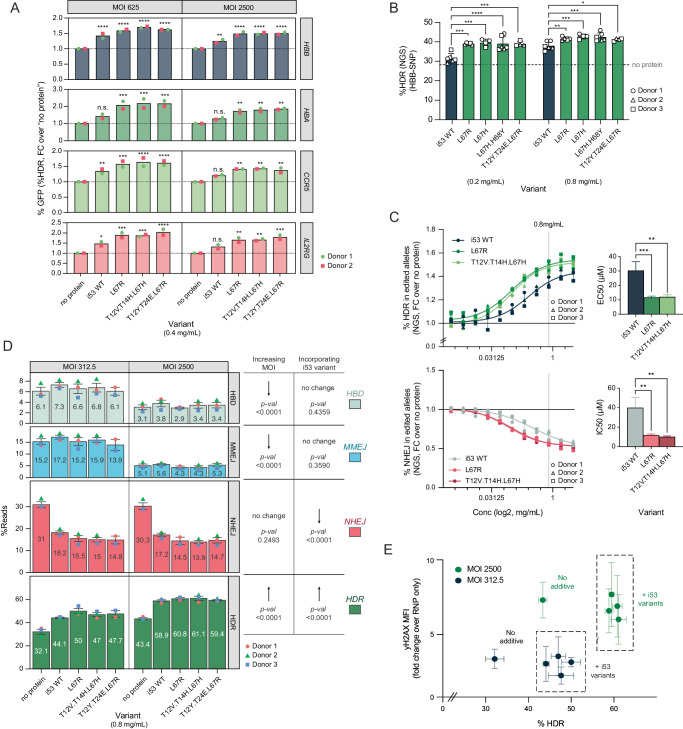
Fig. 3. i53 variants selectively target NHEJ and enable a reduction of DNA repair template.
A Fold change in %GFP-expressing cells when purified variants of i53 are incorporated as protein-based additives to HDR-mediated GFP incorporation into HSPC at different alleles. Absolute numbers shown in Figure S3.2D. n = 2 from two different HSPC donors (both male, 7.5 × 10⁵ cells/cuvette, split across 2 MOI conditions). Bars represent mean. Two-way ANOVA with Dunnett correction. n.s. = non-significant; **p < 0.01; ***p < 0.001; ****p < 0.0001. Exact p-values provided in Source Data File. B %HDR in HSPCs at HBB when edited using sickle-cell correcting HBB-SNP AAV6 with different purified variants of i53 at two different protein concentrations and an MOI of 312.5 (5-7 × 10⁵ cells/cuvette). For variants i53 and L67H.H68Y, n = 6 and for variant L67R and no protein conditions, n = 5 (three HPSC donors). For variants L67H and T12Y.T14E.L67R, n = 4 (two HSPC donors). Mean ± SD depicted. Two-way ANOVA with Dunnett correction. n.s = non-significant; **p < 0.01; ***p < 0.001; ****p < 0.0001. Dotted vertical line: %HDR in ‘no additive’ control. Exact p-values reported on Source Data file. C Dose response curves of i53, L67R, and T12V.T14H.L67H using HBB-SNP AAV at an MOI of 625 in HSPCs. %HDR and %NHEJ iare shown as fold change over no protein additive. Vertical dotted line: selected working concentration (0.8 mg/mL). n = 3 separate HSPC donors (7.5 × 10⁵ cells/cuvette, across 2 AAV6 conditions). Error bars: mean +/- SD. Four-parameter dose response curve fit. Bar charts represent the EC50 and IC50, defined as the i53 variant concentration required for a 50% of maximal increase in HDR or decrease in NHEJ, respectively, along with 95% confidence intervals (error bars). Analyzed by one-way ANOVA, with Sidak adjustment for multiple comparisons. Exact p-values provided in Source Data file. D Effect of increasing MOI and incorporating i53 variants on the editing outcomes at the HBB cut site as quantified by NGS analysis. n = 3 different HSPC donors (2 × 10⁶ cells/cuvette, across 2 MOI conditions); mean ± SEM depicted. Two-way ANOVA analysis, only main effects reported. E %HDR relative to induction of the DNA Damage Response (DDR) as measured by flow cytometry for phosphorylation of histone H2AX (yH2AX) in cells edited with and without addition of the i53 variants, at two different MOI. n = 3 different HSPC donors and mean ± SEM is depicted. i53 variants tested and grouped: i53WT, L67R, T12V.T14H.L67H, T12Y.T24E.L67R. p-values: MOI effect on yH2AX < 0.0001; MOI effect on HDR < 0.0001; additive effect on yH2AX < 0.3606; additive effect on HDR < 0.0001. Two-way ANOVA with Sidak adjustment. A–E Source data are provided as a Source Data file.

