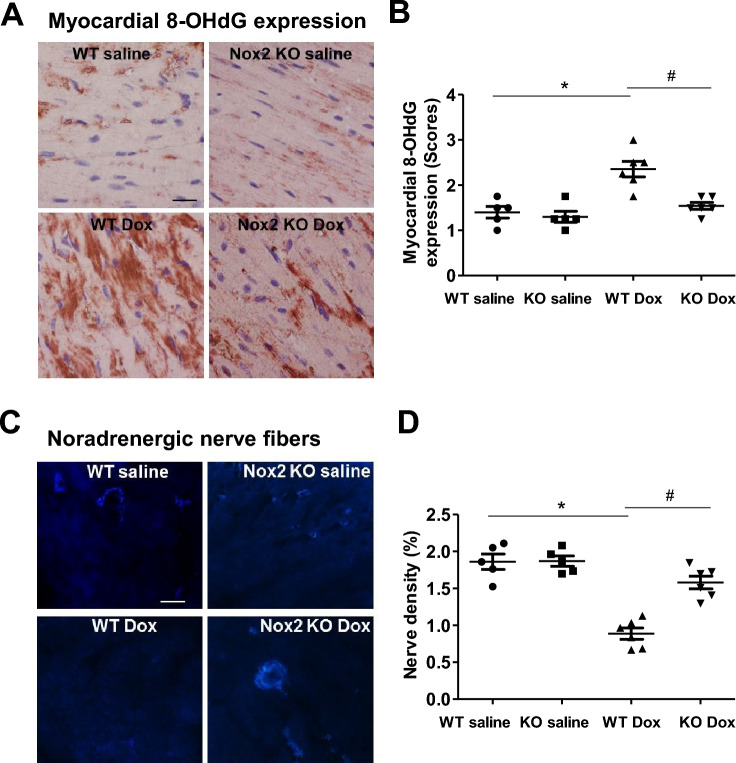
Figure 2.
(A) Immunohistochemical staining for 8-hydroxydeoxyguanosine (8-OHdG) in left ventricular myocardium of WT and Nox2 KO mice with saline or Doxorubicin (Dox) treatment. 8-OHdG staining is shown in red. Nuclie are shown in blue. Bar = 20 μm. (B) The graph shows the relative expression of myocardial 8-OHdG in the four groups. Values are presented as means ± S.E.M.; n = 5–6. *P < 0.05 versus WT saline group. #P < 0.05 versus WT Dox group. (C) Sucrose-potassium phosphate-glyoxylic acid (SPG)-induced histofluorescence for myocardial noradrenergic nerve fibers. Bar = 10 μm. (D) The graph shows the relative noradrenergic nerve density in the four groups. Values are presented as means ± S.E.M.; n = 5–6. *P < 0.05 versus WT saline group. #P < 0.05 versus WT Dox group. Comparisons among groups were performed by one-way ANOVA followed by a Bonferroni post hoc test for multiple comparisons.

