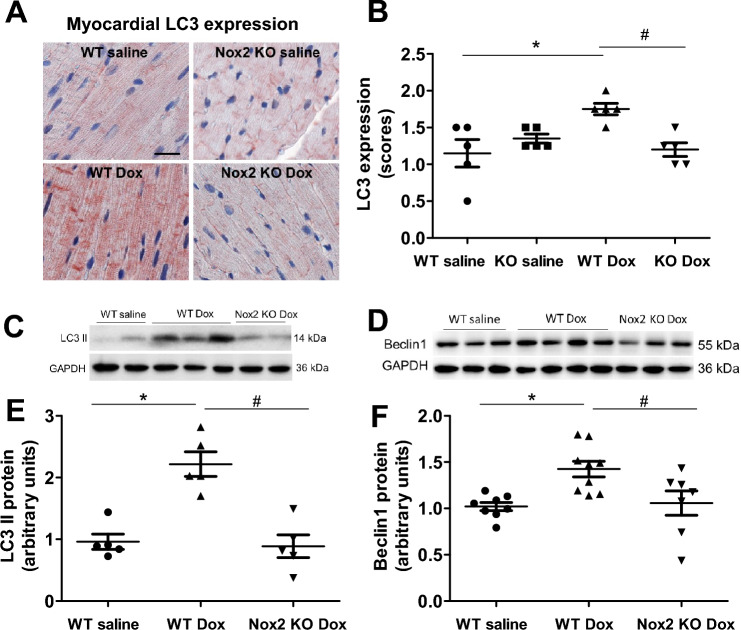
Figure 6.
(A) Immunohistochemical staining for LC3 in left ventricular myocardium of WT and Nox2 KO mice with saline or Doxorubicin (Dox) treatment. LC3 staining is shown in red. Nuclie are shown in blue. Bar = 20 μm. (B) The graph shows the relative expression of myocardial LC3 in the four groups. Values are presented as means ± S.E.M.; n = 5. *P < 0.05 versus WT saline group. #P < 0.05 versus WT Dox group. (C–F) Changes in myocardial LC3 II and Beclin1 proteins in WT saline, WT doxorubicin (Dox) and Nox2 KO Dox groups. (C, D) Representative Western blots of LC3 II and Beclin1 proteins, respectively. Equal loading of proteins is illustrated by GAPDH bands. (E, F) The graphs show the relative expression of LC3 II and Beclin1 proteins in the three groups, respectively. Values are presented as means ± S.E.M.; n = 5 for (E), n = 7–9 for (F). *P < 0.05 versus WT saline group. #P < 0.05 versus WT Dox group. Comparisons among groups were performed by one-way ANOVA followed by a Newman–Keuls (B) or Bonferroni post hoc test (E, F) for multiple comparisons.

