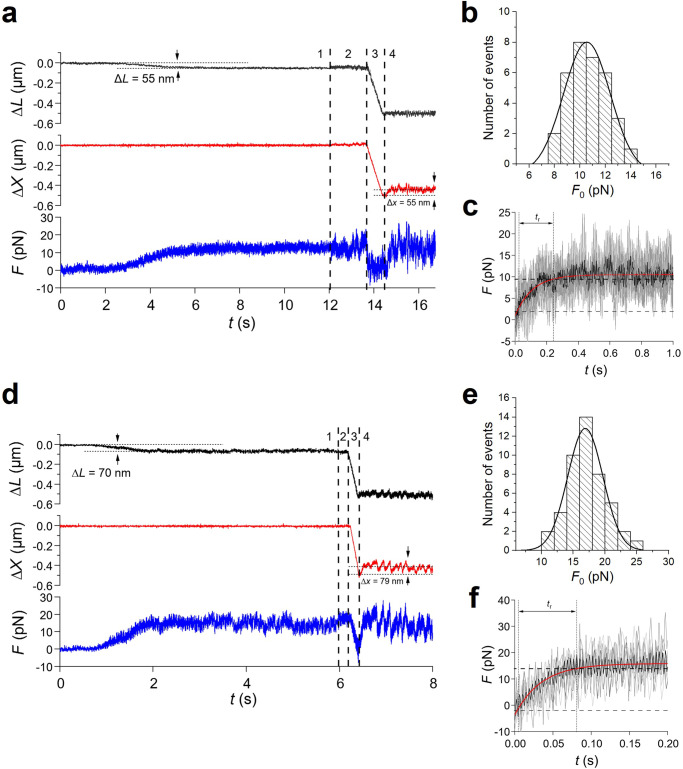
Fig. 4. Active force generation by the nanomachine powered by slow (soleus) and fast (psoas) myosin motors.
a–c Slow myosin array. a Force (F, blue trace), movement of the nanopositioner carrying the motor array (Δx, red trace) and relative sliding between the motor array and the actin filament (ΔL, black trace) during the actin myosin interaction. Phase 1: following the establishment of the contact between the actin filament and myosin motors, the force rises in position clamp to the maximum isometric value (F0 ≃ 12 pN), with the simultaneous sliding of the actin filament by ~55 nm toward the shortening direction to load the trap compliance. Phase 2: the switch to length clamp (marked by the first vertical line) is followed by the increase in force fluctuations superimposed on F0. Phase 3: force drops to zero in response to a rapid shortening of ~500 nm imposed in length clamp (start marked by the second vertical line) with actin filament sliding under zero force. Phase 4: following the end of the imposed shortening (marked by the third vertical line) force redevelops in length clamp with the nanopositioner moving by ~55 nm to counteract the trap compliance and keep the filament sliding at zero. b Frequency distribution of F0. Data are plotted in classes of 1 pN and fitted with a Gaussian (continuous line) with centre 10.5 pN and standard deviation σ = 1.8 pN. c Time course of force redevelopment after rapid shortening (black trace) averaged from 6 records from as many experiments (grey traces). The red line is the single exponential fit to measure tr (the time elapsed from 10%, horizontal thin dashed line, to 90%, thick horizontal dashed line, of F0 recovery). d–f Fast myosin array. d F, Δx and ΔL, defined and colour coded as in (a). Phases 1–4 as described in (a). e Frequency distribution of F0 plotted in classes of 2 pN and fitted with a Gaussian (continuous line) with centre 17 pN and standard deviation σ = 3 pN. f Time course of force redevelopment after rapid shortening (black trace) averaged from 7 records from as many experiments (grey traces). The red line is the single exponential fit to measure tr labelled as in (c).

