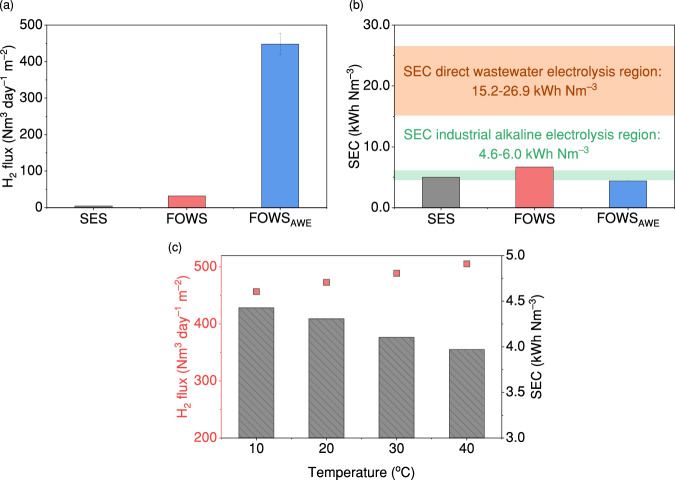
Fig. 4. H2 production and energy efficiency of the FOWSAWE system.
a The comparison in H2 flux among three membrane-based P2H systems (error bar represents the standard deviation from three independent replicates); b the comparison in specific energy consumption (SEC) among three membrane-based P2H systems. The orange region represents the SEC range typical for direct wastewater electrolysis. The green region represents the SEC range for industrial alkaline water electrolysis; c H2 flux and SEC of the FOWSAWE system changed with KOH temperatures. Source data are provided as a Source Data file.

