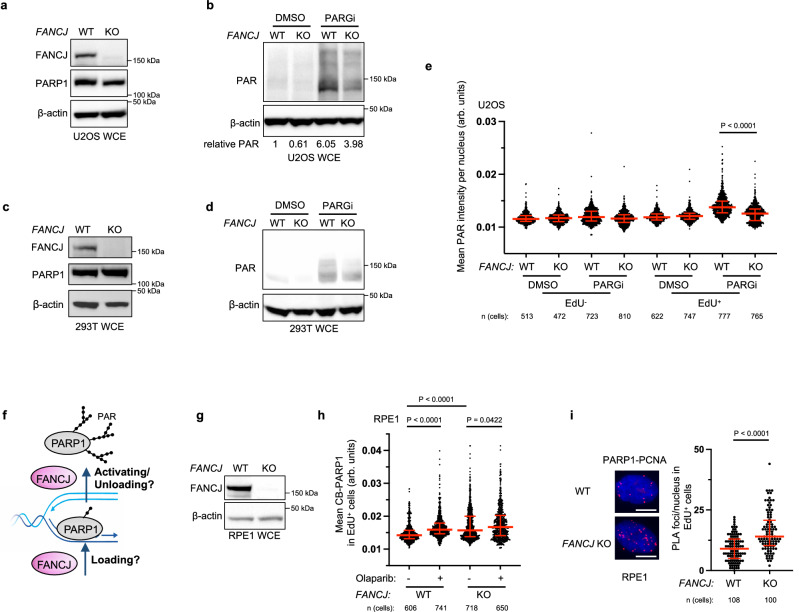
Fig. 1. Modest PARPi sensitivity of FANCJ deficient cells is associated with low S-phase PAR and enhanced PARP1 chromatin loading.
a Representative western blot (WB) from two independent experiments for analysis of the expression levels of the indicated proteins from whole cell lysates in untreated WT vs FANCJ KO U2OS cells. b Representative WB analyzing PAR from whole cell lysates in indicated U2OS cells treated with DMSO or PARG inhibitor (PARGi, 10 µM) for 40 min prior to harvesting to block PAR removal. Mean relative PAR from three independent experiments normalized to β-actin shown. c Representative WB from two independent experiments for analysis of the expression levels of the indicated proteins from whole cell lysates in untreated WT vs FANCJ KO 293T cells. d Representative WB from two independent experiments showing the PAR formation in indicated 293T cells treated with DMSO or PARG inhibitor (PARGi, 10 µM) for 40 min prior to harvesting to block PAR removal. e Quantification of mean PAR intensity per nucleus for WT and FANCJ KO U2OS cells treated with DMSO or PARGi (10 µM, 30 min) together with EdU incubation. Data are from three independent experiments. Each dot represents one cell. Red bars represent the median ± interquartile range. All statistical analysis according to Kruskal–Wallis test, followed by Dunn’s test. f Schematic showing how FANCJ impacts PAR formation during replication: could FANCJ impact PARP1 loading and/or releasing during replication? g Representative WB from three independent experiments for analysis of the expression levels of the indicated proteins from whole cell lysates in untreated WT vs FANCJ KO RPE1 cells. h Quantification of chromatin-bound PARP1 (CB-PARP1) for RPE1 WT and FANCJ KO with or without Olaparib treatment (10 µM, 2 h) with EdU incubated in the final 30 min. Data are from three independent experiments. Each dot represents one cell. Red bars represent the median ± interquartile range. All statistical analysis according to Kruskal-Wallis test, followed by Dunn’s test. i PARP1-PCNA proximity ligation assay (PLA) in untreated RPE1 WT vs FANCJ KO cells, with 10 µM EdU incubated for 20 mins. Dot plot shows the number of foci per EdU+ cell and the red bars represent median ± interquartile range from three independent experiments. Scale bars, 10 µm. Statistical analysis according to two-tailed Mann–Whitney test. Representative images shown with PLA foci in red, scale bars 10 µm. For e, h, and i; 5-ethynyl-2′-deoxyuridine (EdU)-positive or EdU+ cells were gated to identify positive EdU incorporation (S-phase). Source data are provided as a Source Data file.

