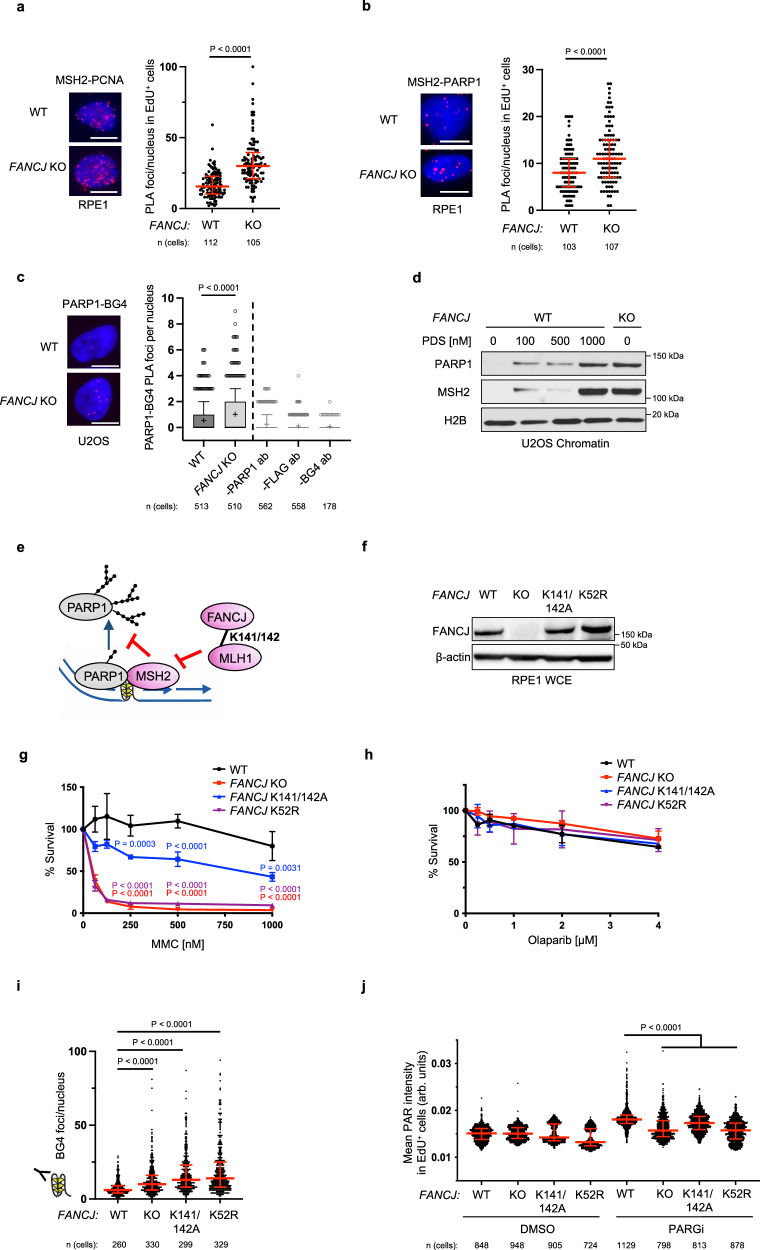
Fig. 2. S-phase PAR requires FANCJ helicase and MLH1 binding activities.
a MSH2-PCNA proximity ligation assay (PLA) in untreated RPE1 WT vs FANCJ KO cells with EdU incubated for 20 mins. Dot plot shows the number of foci per EdU+ cell and the red bars represent median ± interquartile range from three independent experiments. Statistical analysis according to two-tailed Mann–Whitney test. Representative images shown with PLA foci in red, scale bars 10 µm. b MSH2-PARP1 PLA in untreated RPE1 WT vs FANCJ KO cells with EdU incubated for 20 min. Dot plot shows the number of foci per EdU+ cell and the red bars represent median ± interquartile range from three independent experiments. Statistical analysis according to two-tailed Mann-Whitney test. Representative images shown with PLA foci in red, scale bars 10 µm. c PARP1-BG4 PLA in untreated U2OS WT vs FANCJ KO cells. The mean of the data are represented by a “+”, the bounds of box indicate first and third quartile while the whiskers indicate 10th and 90th percentile. Data are from three independent experiments except for the negative BG4 antibody control (1 experiment). Scale bars, 10 µm. Statistical analysis according to two-tailed Mann–Whitney test. Representative images shown with PLA foci in red, scale bars 10 µm. d Representative WB from three independent experiments of chromatin bound PARP1 and MSH2 in 24 h PDS treated U2OS WT cells compared to untreated WT and FANCJ KO cells. e Model showing MSH2 could limit PARP1 activation and be regulated by the FANCJ-MLH1 interaction. f WB analysis of FANCJ in the whole cell lysates of FANCJ knock-in mutant cells. Representative from three independent experiments. g Cell survival assays for indicated cells under increasing concentrations of mitomycin C (MMC). Dots represent the mean percentage ±SD of survival for each cell line and drug concentration from three independent experiments. Significance was determined by one-way ANOVA followed by Dunnett’s test comparing FANCJ WT to mutant cells. P-value color matches sample in key and compares to WT. h Cell survival assays for indicated cells under increasing concentrations of Olaparib. Dots represent the mean percentage ±SD of survival for each cell line and drug concentration from three independent experiments. i Quantification of G-quadruplex (BG4 antibody) foci/nucleus in RPE1 mutant cells under untreated growth conditions. Representative from two independent experiments. Statistical analysis according to Kruskal-Wallis test, followed by Dunn’s test. j Quantification of PAR after 30 min DMSO or PARGi (10 µM) treatment with EdU in EdU+ RPE1 WT, FANCJ KO, FANCJ K141/142A and K52R cells. Red bars represent the median ± interquartile range. Representative from three independent experiments. Statistical analysis according to Kruskal–Wallis test, followed by Dunn’s test. For a, b, and j; 5-ethynyl-2′-deoxyuridine (EdU)-positive or EdU+ cells were gated to identify positive EdU incorporation (S-phase). Source data are provided as a Source Data file.

