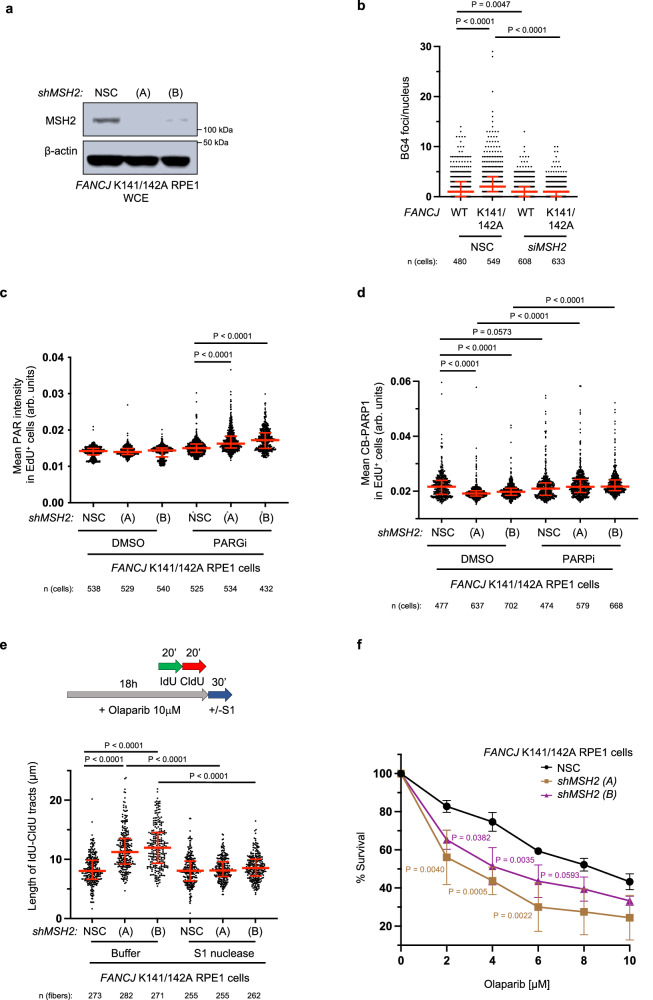
Fig. 4. The FANCJ-MLH1 interaction promotes PARP1 activation by restricting MSH2.
a Representative WB from three independent experiments for the indicated proteins from whole cell lysates from RPE1 cells expressing small hairpin RNA (shRNA) against non-silencing control (NSC) and two shRNAs targeting MSH2 (A) and (B). b Quantification of G-quadruplexes (BG4 antibody) in the indicated RPE1 cells with siRNA under untreated growth conditions. Each dot represents one cell from three independent experiments. Red bars represent the median ± interquartile range. Statistical analysis according to Kruskal-Wallis test, followed by Dunn’s test. c Quantification of PAR after 30 min DMSO or PARGi (10 µM) treatment in the indicated EdU+ RPE1 cells. Each dot represents one cell from three independent experiments. Red bars represent the median ± interquartile range. Statistical analysis according to Kruskal–Wallis test, followed by Dunn’s test. d Quantification of CB-PARP1 in the indicated cells with or without Olaparib treatment (10 µM, 6 h), with EdU incubated at the final 40 min. Each dot represents one cell from three independent experiments. Red bars represent the median ± interquartile range. Statistical analysis according to Kruskal–Wallis test, followed by Dunn’s test. e Schematic and quantification of the S1 nuclease DNA fiber assays for the length of dual-color tracts in indicated cells following Olaparib treatment (10 µM, 18 h). Each dot represents 1 fiber; data are from three independent experiments. Red bars represent the median ± interquartile range. Statistical analysis according to Kruskal–Wallis test, followed by Dunn’s test. f Cell survival assays for indicated RPE1 cells under increasing concentrations of Olaparib. Dots represent the mean percentage ±SD of survival for each cell line and drug concentration from four independent experiments. Significance was determined by one-way ANOVA followed by Dunnett’s test, P-value color matches sample in key and compares to NSC. For c and d; 5-ethynyl-2′-deoxyuridine (EdU)-positive or EdU+ cells were gated to identify positive EdU incorporation (S-phase). Source data are provided as a Source Data file.

