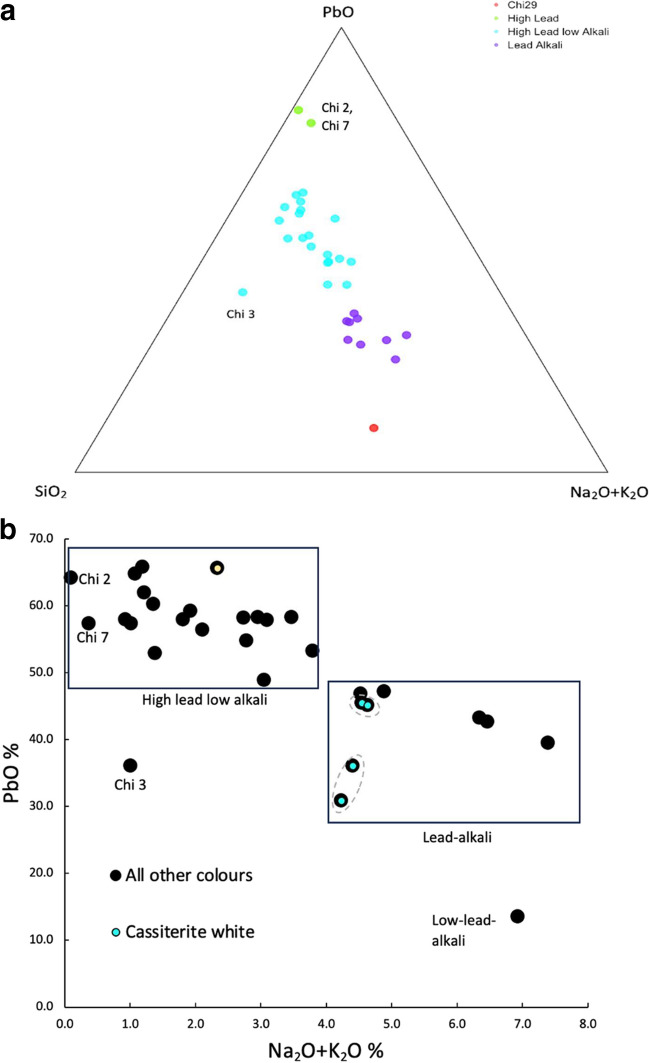
Fig. 5.
Plots showing the composition of the glazes analysed. a) Ternary diagram showing the major chemical compositions for the high lead low alkali, lead alkali and one outlier. Samples Chi 2, 7 and 3 present a weathered glaze. Chi 27 is opaque yellow. b) Biplot of 15b Owt% vs Na2O + K2O wt% for the glazes analysed showing that the cassiterite opacified samples are enriched in alkalis. Two areas (and thus two points) of samples Chi 6 and Chi 30 are shown in graph b, to take into account the inhomogeneity due to the presence of tin-rich areas (encircled in graph b)

