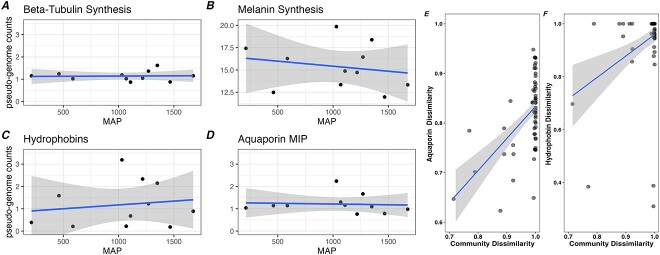
Figure 2.
(A-D). Normalized abundance of gene family counts across the precipitation gradient: Mean annual precipitation (MAP). In order to account for variation in sequencing depth and the compositional nature of the metagenomic data, we performed a procedure that normalizes gene counts by those encoding the near single-copy gene Asparaginase. This additive log-ratio procedure, allows for the calculation of pseudo-genome counts for key gene families. Lines represent linear splines with 95% confidence intervals. (E-F). Correlations between EMF community dissimilarity (Bray–Curtis), and aquaporin and Hydrophobin sequence dissimilarity based on Pfam homology.

