Fig. 2.
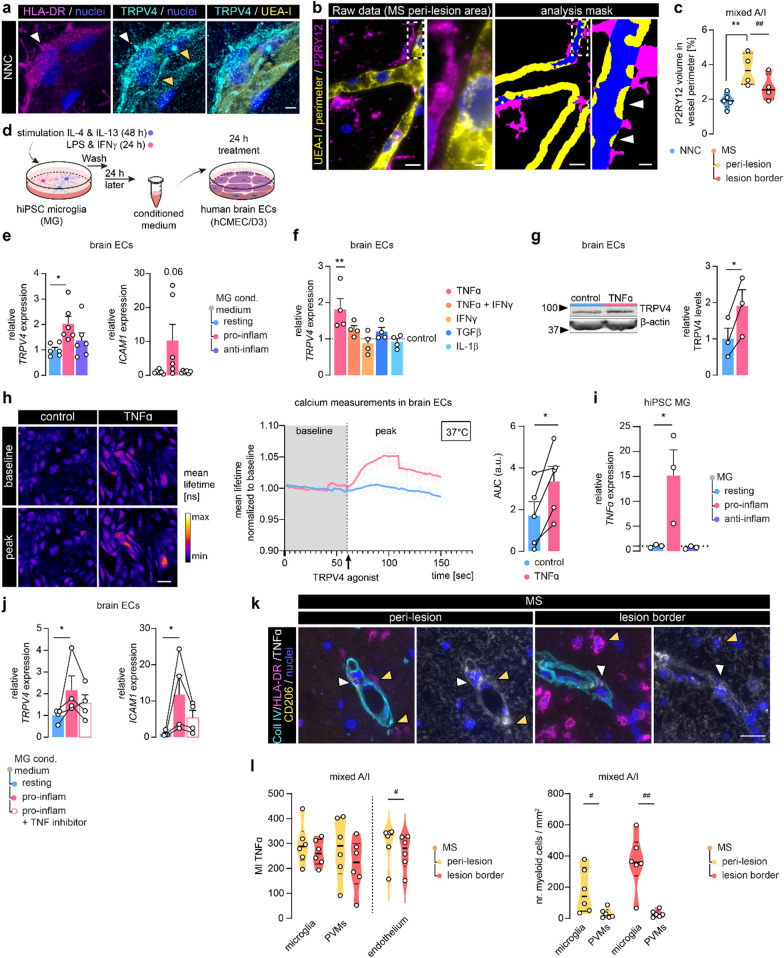
Microglia-derived TNFα induces TRPV4 expression in brain endothelial cells. a Representative confocal image of UEA-I, HLA-DR, and TRPV4 immunoreactivity in NNC tissue. The white arrowhead demonstrates TRPV4 in HLA-DR+ cells; orange arrowheads highlight endothelial, junctional TRPV4 reactivity; scale bar: 5 µm. b Representative images of UEA-I and P2RY12 (microglia) immunoreactivity in MS tissue (left); masks for 3D microglia-vasculature proximity analysis (right). Arrowheads indicate microglia volume (blue) within the vascular perimeter (yellow: 5 µm); scale bar: 10 µm, panel: 2 µm. c Quantification of microglia volume within vessel perimeter, N cases = 4–5. d Schematic of human brain ECs (hCMEC/D3) treatment with hiPSC microglia conditioned medium (MG cond. medium). e TRPV4 and ICAM1 measured in brain ECs treated with MG cond. medium, N = 6. f TRPV4 in brain ECs treated with cytokines relative to control, N = 4. g Protein levels of TRPV4 measured in TNFα-treated brain ECs normalized to a reference protein, N = 3. h Quantification of TRPV4 agonist-mediated calcium response in brain ECs treated with TNFα by the area under the curve (AUC) (GSK1016790A, 100 nM). Measurements were performed at 37 °C and normalized to baseline, N experiments = 5, N cells = 30–40; scale bar: 50 µm. i TNFα measured in hiPSC MG, N = 3. j TRPV4 and ICAM1 measured in brain ECs treated with pro-inflammatory cond. MG medium with/without TNF inhibitor, N = 4 k Representative images of TNFα, HLA-DR, CD206, and Coll IV immunoreactivity in MS tissue; white arrowheads indicate CD206+ perivascular macrophages (PVMs), orange arrowheads indicate microglia (HLA-DR+,CD206−, outside Coll IV); scale bar: 25 µm. l Quantification of TNFα mean intensity in microglia, PVMs, and endothelium and myeloid cell count. Data is shown as the mean ± SEM and statistics were calculated for three groups by one-way ANOVA with Bonferroni or Dunnett's multiple comparisons test or non-parametric Kruskal–Wallis with Dunns test. Comparison of two groups was performed using paired Student’s t-test indicated by connecting lines or within MS tissues (*p < 0.05, **p < 0.01; #p < 0.05, ##p < 0.01)

