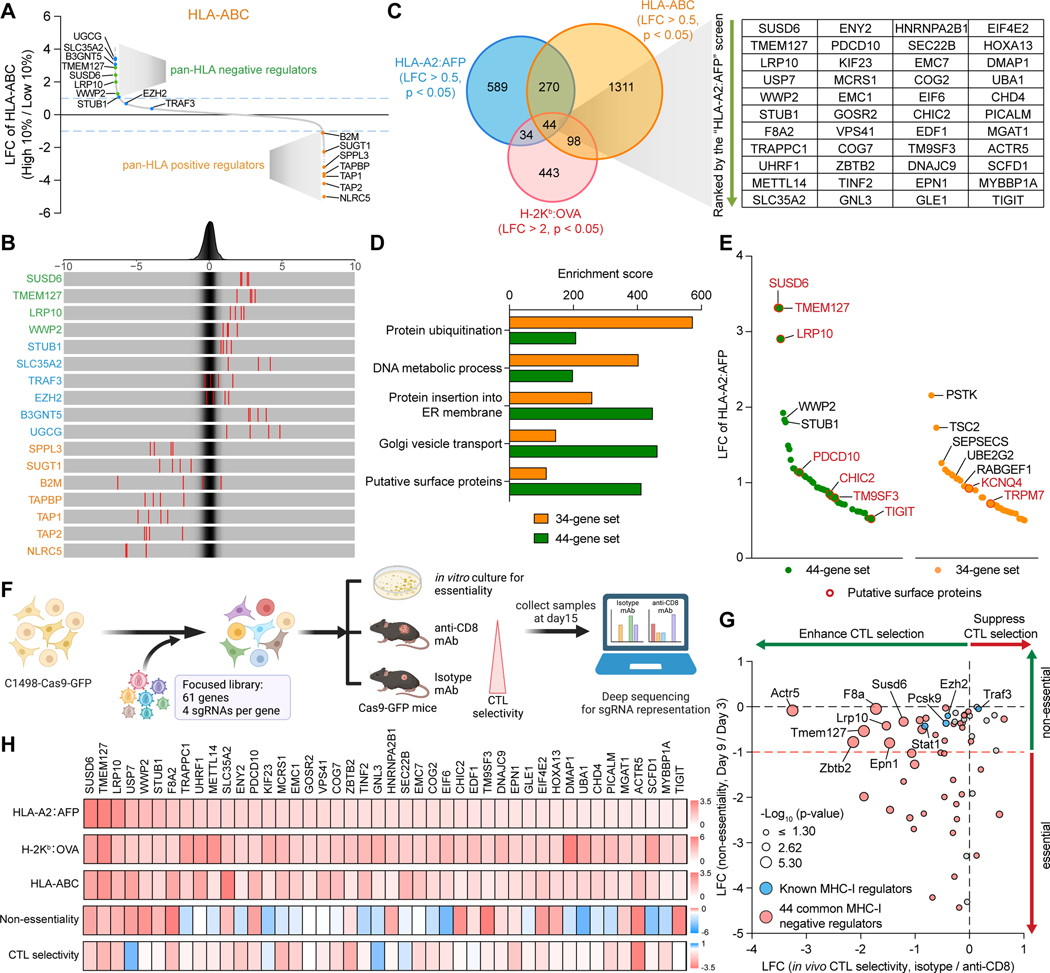
Figure 2. Integration of pan-HLA and in vivo CRISPR screen identifies functional MHC-I inhibitors. See also Figure S2.
(A and B) Waterfall plot (A) and frequency histograms (B) depicting the LFCs of the selected regulators in the human pan-HLA (HLA-ABC) screen. Green: novel pan-HLA negative regulators, blue: published MHC-I negative regulators, orange: known pan-HLA positive regulators.
(C) Venn diagram of the negative regulators in all three screens.
(D) Enrichment analyses comparing the 44-gene set and the 34-gene set in different categories of biological functions defined in Figure 1H and putative surface expression.
(E) Waterfall plot depicting the LFCs of the negative regulators from the 44-gene set and the 34-gene set in the HLA-A2:AFP screen. Putative surface proteins were highlighted in red.
(F) Schematic of the in vivo focused screens in the C1498 murine AML cell line.
(G) Scatter plots showing the non-essentiality of each candidate identified by in vitro cell growth (Y-axis) and the in vivo CTL selectivity of each targeted gene identified by comparison of tumors from Isotype versus anti-CD8 mAb-treated mice (X-axis).
(H) Heatmaps showing the LFCs of the 44 common negative AP regulators in the indicated screens.

