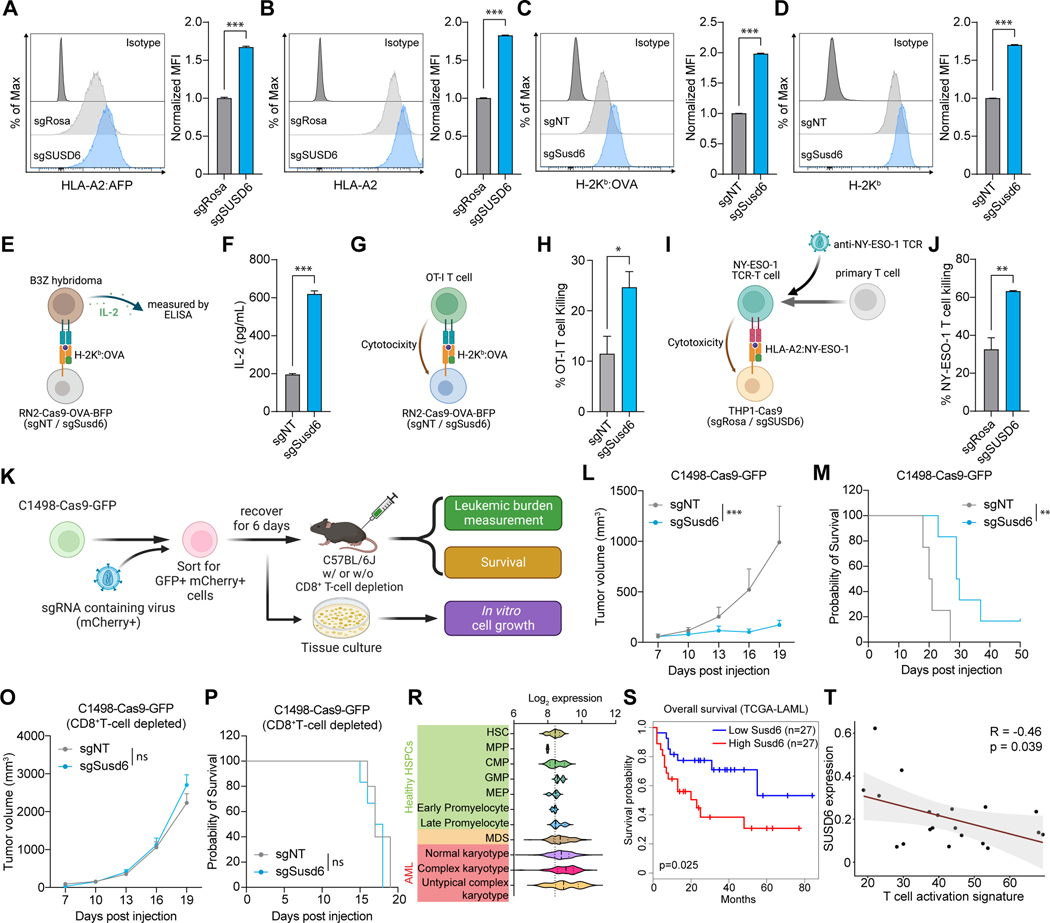
Figure 3. SUSD6 suppresses MHC-I expression and CD8+ T cell immunity in AML. See also Figure S3.
(A-D) Representative histograms (left) and bar plots (right) showing the surface levels of HLA-A2:AFP (A) or HLA-A2 (B) in human THP-1-Cas9-AFP-BFP cells, and the surface levels of H-2Kb:OVA (C) or H-2Kb (D) in mouse RN2-Cas9-OVA-BFP cells transduced with the indicated sgRNAs. (n=3)
(E and F) Schematic of the T cell activation assay (E) and bar plot showing the IL-2 secreted by the B3Z T cell hybridoma incubated with sgRNA-transduced RN2-Cas9-OVA-BFP cells (F). (n=3)
(G and H) Schematic of the mouse T cell killing assay (G) and bar plot showing the percentages of sgRNA-transduced RN2-Cas9-OVA-BFP cells killed by the OT-I T cells (H). (n=3)
(I and J) Schematic of the human T cell killing assay (I) and bar plot showing the percentages of sgRNA-transduced NY-ESO-1-expressing THP-1-Cas9 cells killed by the NY-ESO-1 TCR-T cells (J). (n=3)
(K) Schematic of the in vivo validations of SUSD6 functions in a mouse syngeneic AML model.
(L-P) Quantification of the tumor volumes (L and O) and Kaplan-Meier survival curves (M and P) of immunocompetent (L and M) or CD8+ T cell-depleted (O and P) mice transplanted with sgRNA-transduced C1498-Cas9-GFP cells as described in (K). (for L and M: n=4 for sgNT and n=6 for sgSusd6; for O and P: n=5 for sgNT and n=6 for sgSusd6)
(R) Violin plot of SUSD6 mRNA levels in normal HSPCs, MDS cells, and AML cells with different karyotypes from patient samples. HSPCs, hematopoietic stem and progenitor cells; HSC, hematopoietic stem cell; MPP, multipotent progenitor; CMP, common myeloid progenitor; GMP, granulocyte-monocyte progenitor; MEP, megakaryocyte-erythrocyte progenitor; MDS, myelodysplastic syndromes. Data were obtained from BloodSpot.51
(S) Survival of AML patients with high or low expression of SUSD6 in the TCGA-LAML cohort.
(T) Pearson correlation of SUSD6 expression levels in AML cells and T cell activation signature in CD8+ T cells from the bone marrow immuno-microenvironments from AML patients. Data were generated by single-cell RNA-seq.53
Data are presented as the mean ± SEM. ns, not significant; *, p< 0.05; **, p< 0.01; and ***, p< 0.001 by two-tailed unpaired Student’s t-test (A-D, F, H, and J), two-way ANOVA for the last time point (L and O), or Log-rank Mantel-Cox test (M and P). Rosa26-targeting sgRNA (sgRosa, for human) and non-targeting sgRNA (sgNT, for mouse) were used as controls.

