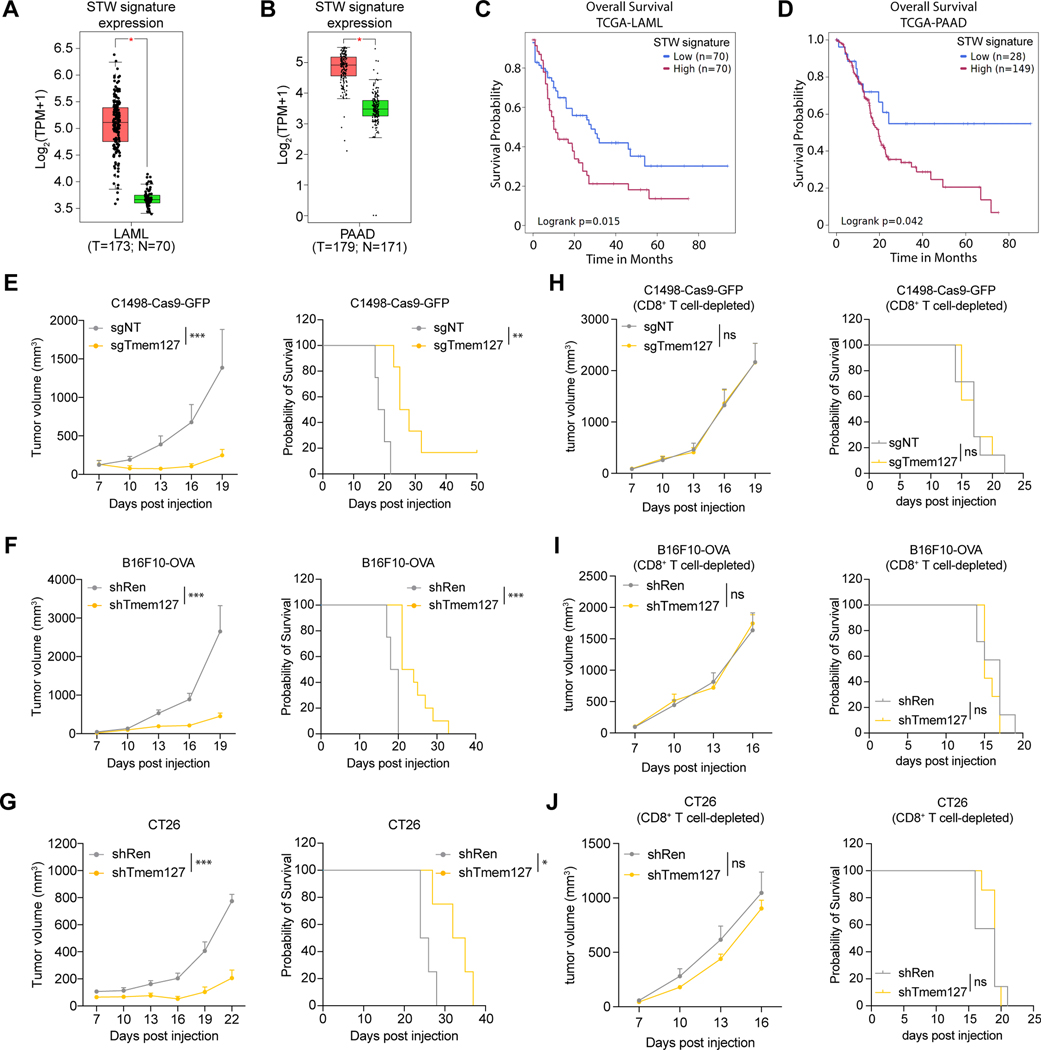
Figure 7. Targeting the SUSD6/TMEM127/WWP2 complex enhances MHC-I expression and cancer immunity. See also Figure S7.
(A-B) Expression of the STW gene signature in AML (A) and PAAD (B). Red, cancer cells; Green, normal tissue. Data were obtained from the TCGA database and analyzed by GEPIA2.69
(C-D) Association of high or low STW gene signature with the overall survival of AML (C) or PAAD (D) patients in the TCGA database by SurvivalGenie.70
(E-J) Quantifications of the tumor volumes (left) and Kaplan-Meier survival curves (right) of immunocompetent (E-G) or CD8+ T cell-depleted (H-J) mice transplanted with C1498-Cas9-GFP (E and H), B16F10-OVA (F and I), or CT26 (G and J) cells transduced with the indicated sgRNAs or shRNAs. (for E: n=4 for sgNT and n=6 for sgTmem127; for F: n=4 for shRen and n=10 for shTmem127; for G: n=4 for shRen and n=5 for shTmem127; for H-J: n=7)
Data are presented as box and whiskers with all data points (A-B) or the mean ± SEM (E-J left). ns, not significant; *, p< 0.05; **, p< 0.01; and ***, p< 0.001 by two-way ANOVA for the last time point (E-J left), or Log-rank Mantel-Cox test (E-J right). shRen and sgNT were used as controls.

