Figure 4.
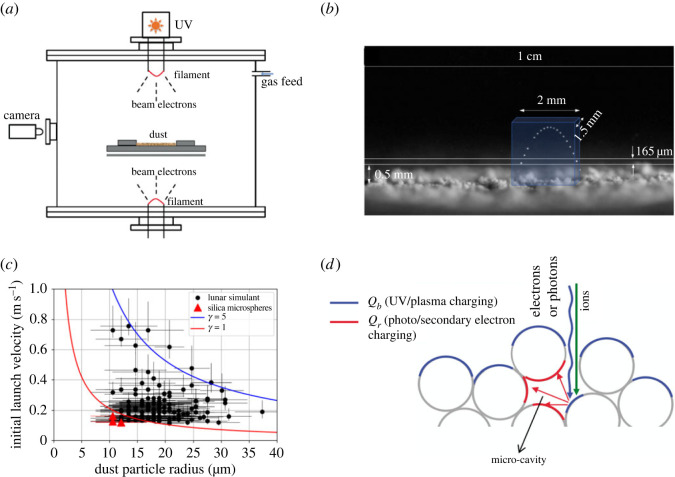
(a) The schematic of the experimental set-up to investigate dust charging, mobilization and transport under UV and/or plasma exposure of a regolith surface [59–62]. (b) Stacked images of the trajectory of a single dust particle lofted from the surface, using a narrow focal plane normal to the boresight of the camera. Images like this are used to measure the initial speed of the particle [62]. (c) Initial launch velocities as a function of dust size for irregularly shaped lunar simulant particles (circles) and radius silica microspheres (triangles). The theoretical curves (solid lines), obtained from energy conservation, are shown with and 5 that parameterize the cohesion between particles [62]. (d) Cartoon of the ‘patched charge model’ [59].

