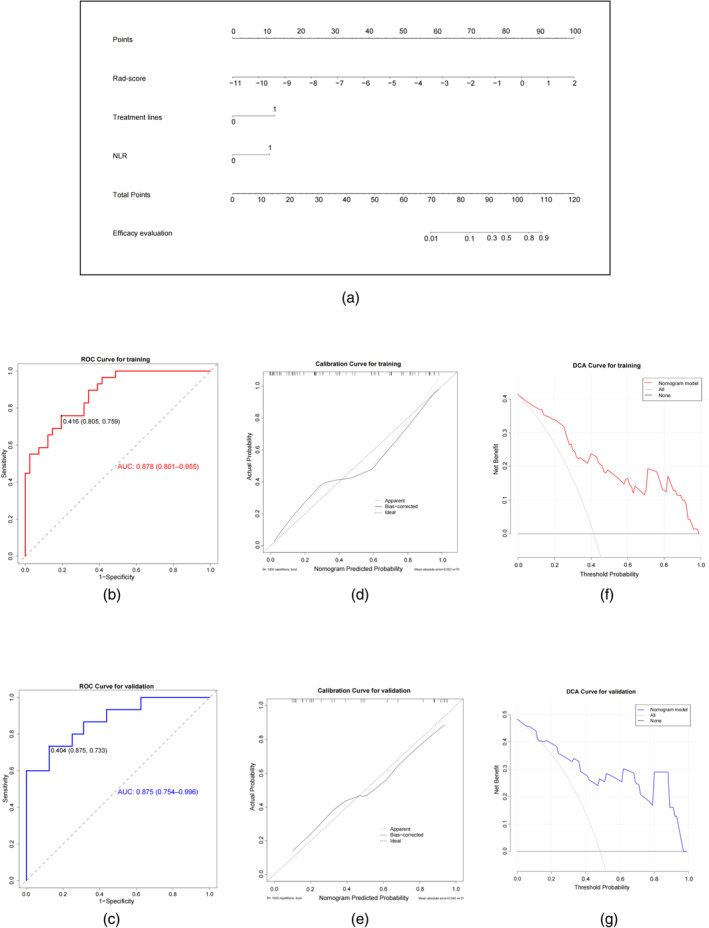
FIGURE 3.

Radiomics nomogram and related model performance evaluation. (a) The radiomics nomogram was developed in the primary cohort, with Rad‐score, treatment lines, and neutrophil‐to‐lymphocyte ratio (NLR) incorporated. The receiver operating characteristic (ROC) curves of the radiomics nomogram in the training cohort (b) and validation cohort (c). The calibration curves of the radiomics nomogram demonstrated satisfactory agreement between prediction and observation in both the training (d) and test cohorts (e). Decision curve analysis for the radiomics nomogram in the training cohort (f) and validation cohort (g). The y‐axis measures the net benefit, and the x‐axis represents the threshold probability. The black line at the bottom represents the hypothesis that no patients had a good intracranial response. The gray line represents the hypothesis that all patients had a good intracranial response. The red and blue lines represent the net benefit of the radiomics nomogram at different threshold probabilities.
