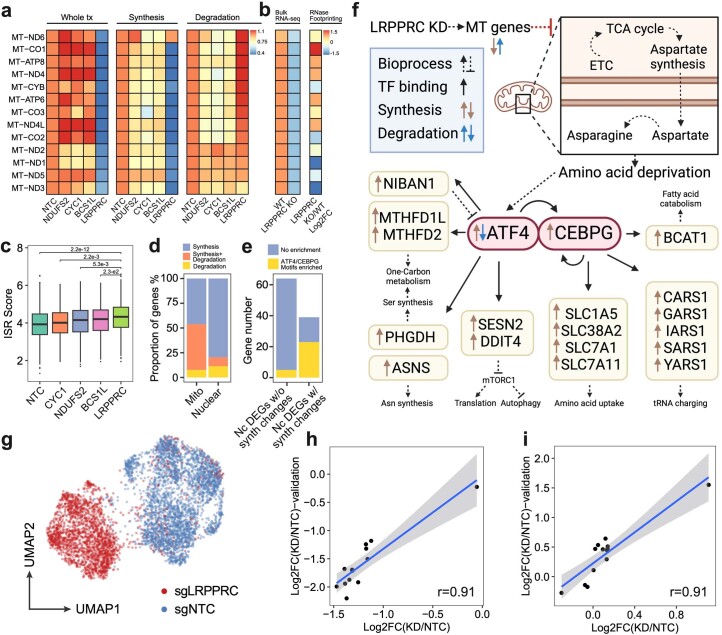
Extended Data Fig. 8. PerturbSci-kinetics identified LRPPRC as the master regulator of mitochondrial RNA dynamics.
a. Heatmap showing the relative FC of gene expression, synthesis and degradation rates of mitochondrial protein-coding genes upon NDUFS2, CYC1, BCS1L and LRPPRC knockdown compared to NTC cells. b. The heatmap (left) showed mean z-scored mitochondrial gene expression changes between wild-type and LRPPRC-knockout mice heart tissue samples reported by Siira, S.J., et al.33. The DEG statistical examination was conducted by the original study. The heatmap (right) showed the FC of the mRNA secondary structure increase upon LRPPRC knockdown observed in the same prior report33, which positively correlated with the accelerated degradation of mitochondrial genes detected in our study (coefficient of Pearson correlation = 0.708, p-value = 6.8e-3). c. Boxplot showing the distribution of integrated stress response scores of single cells (n = 2758, 478, 768, 631, 504 cells in each group from left to right). Dunnett’s test after one-way ANOVA was performed. ISR, integrated stress response. ISR score, the average normalized expression of genes within the ISR transcription program identified by Genome-wide Perturb-seq8. d. Barplot showing the fraction of genes regulated by synthesis, degradation or both in mitochondrial/nuclear-encoded DEGs. e. Barplot showing the enrichment of ATF4/CEBPG motifs at promoter regions of DEGs with/without significant synthesis changes. We identified two transcription factors (ATF4 and CEBPG) that were significantly upregulated upon LRPPRC knockdown, and motifs of their protein product were significantly over-represented in TSS regions of the synthesis-regulated nuclear-encoded DEGs. Nc DEGs w/o synth changes, Nuclear-encoded DEGs without synthesis changes. Nc DEGs w/ synth changes, Nuclear-encoded DEGs with synthesis changes. f. The transcriptional regulatory network in LRPPRC perturbation inferred from our analysis. It was consistent with the prior study64 that ATF4 was regulated at both transcriptional and post-transcriptional levels. g. Single-cell UMAP of HEK293-idCas9-sgNTC/sgLRPPRC cells in the validation dataset. h, i. Correlations of synthesis and degradation rate changes of mitochondrial mRNA upon LRPPRC knockdown between the original screen and the validation dataset. A linear regression line was fitted and ±95% confidence intervals are visualized for each metric. r, coefficient of Pearson correlation. Boxes in boxplots indicate the median and IQR with whiskers indicating 1.5× IQR.

