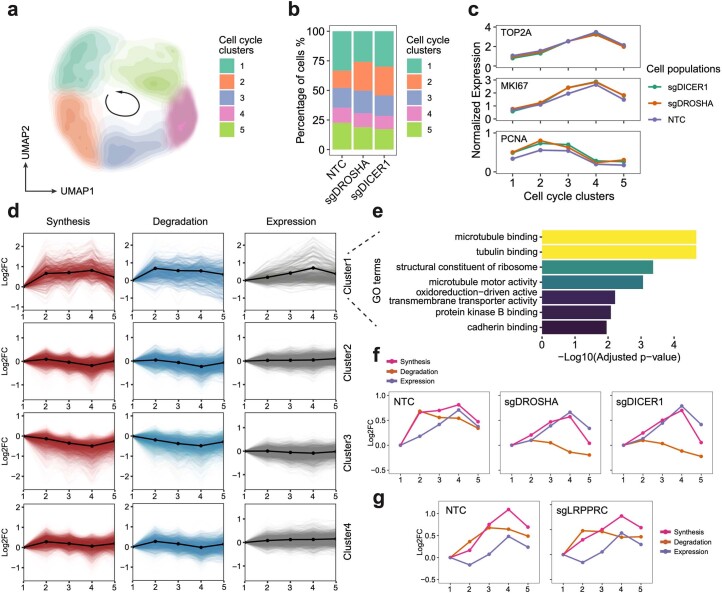
Extended Data Fig. 10. PerturbSci-Kinetics enables dissecting the effects of perturbations on cell cycle-dependent RNA dynamics.
a. UMAP embedding of cells with miRNA pathway genes knockdowns and NTC cells reflected the cell-cycle progression. b. Stacked barplot showing the cell cycle distribution of cells from each perturbation. c. The expression changes of cell cycle marker genes in cell cycle clusters. d. The cell cycle time-course synthesis rates, degradation rates, and steady-state expression changes of 4 gene clusters. Solid lines with dots, the mean values and the average trend of all genes within the cluster. e. The top enriched GO terms of genes in the cluster 1 identified in GO enrichment analysis. f. Averaged trends of cell cycle time-course synthesis rates, degradation rates, and steady-state expression changes of cluster 1 genes in HEK293-idCas9-sgNTC, sgDROSHA, sgDICER1 cells. g. Averaged trends of cell cycle time-course synthesis rates, degradation rates, and steady-state expression changes of genes in cluster 1 in HEK293-idCas9-sgNTC and sgLRPPRC cells. Considering potential strong batch effects from distinct genetic perturbation, cell cycle clustering analysis in (g) was performed independently of (a), and cell cycle clusters in (g) were not fully synchronized with clusters in (f).

