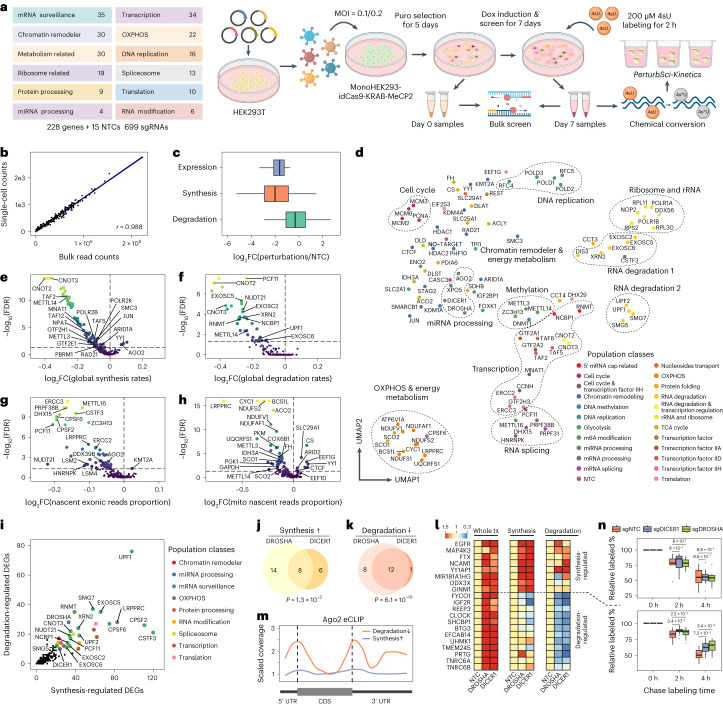
Fig. 2. Characterizing the impact of genetic perturbations on gene-specific transcriptional and degradation dynamics with PerturbSci-Kinetics.
a, Scheme of the experimental design. b, Scatter plot shows the correlation between perturbation-associated cell count from PerturbSci-Kinetics and sgRNA read counts from bulk screen libraries. c, Box plot showing the log2-transformed FCs of gene expression, synthesis rates and degradation rates of sgRNA-targeted genes (n = 203 genes) in perturbed cells expressing the corresponding sgRNA compared to NTC. d, UMAP visualization of perturbed pseudobulk whole transcriptomes profiled by PerturbSci-Kinetics. We aggregated single-cell transcriptomes in each perturbation, followed by dimension reduction using PCA and visualization using UMAP. Population classes: the functional categories of genes targeted in different perturbations. e–h, Scatter plots showing the extent and the significance of changes on the distributions of global synthesis (e), degradation (f), proportions of exonic reads in the nascent transcriptome (g) and proportions of mitochondrial nascent reads (h) upon perturbations compared to NTC cells. The FCs were calculated by dividing the median values of each perturbation with that of NTC cells and were log2 transformed. Dashed lines indicate the statistical thresholds that were used (horizontal line, −log10(0.05); vertical line, 0). i, Scatter plot showing the number of synthesis/degradation-regulated DEGs from different perturbations. nDEGs, number of DEGs. j,k, Venn diagrams showing the number of merged DEGs with significantly enhanced synthesis (j) or impaired degradation (k) between DROSHA and DICER1. One-sided Fisher’s exact tests were conducted with the alternative hypothesis that the true odds ratio is greater than 1. l, Heat maps showing the steady-state expression, synthesis and degradation rate changes of genes included in j–k. Tiles of each row are colored by FCs of values of perturbations relative to NTC. tx, transcriptome. m, Line plot showing the AGO2 binding patterns on transcripts of protein-coding genes in j–k revealed by eCLIP signal intensity. Data were obtained from a previous study42. Dashed lines indicate the position of the beginning of CDS (left) and the beginning of 3′ UTR (right). n, Box plots showing the relative proportion of labeled mRNA of transcription-regulated genes (n = 8) and degradation-regulated genes (n = 12) after chase labeling for different times in HEK293-idCas9-sgNTC, sgDROSHA and sgDICER1 cells. Two-sided Studentʼs t-tests were performed between knockdown groups and the NTC group. Boxes in box plots indicate the median and interquartile range (IQR), with whiskers indicating 1.5× IQR. OXPHOS, oxidative phosphorylation; Puro, puromycin.

