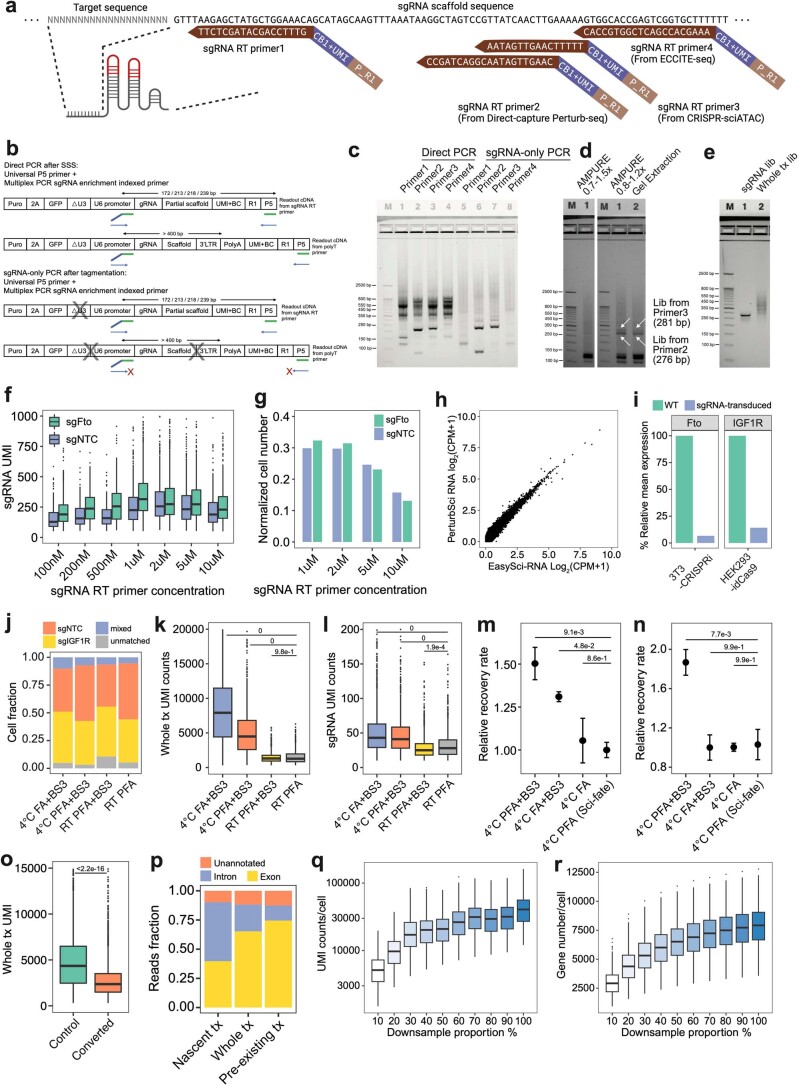
Extended Data Fig. 2. Representative optimizations of PerturbSci.
a. sgRNA primers of different designs were mixed with polyT primers respectively for RT. CB, cell barcode. P_R1, partial TruSeq read1 sequence. b-c. After RT, the capture efficiency of sgRNA by different RT primers was evaluated by ‘Direct PCR’, and the efficiency of by-product removal was examined by ‘sgRNA-only PCR’. 3 independent experiments were conducted. d. Different post-multiplex PCR purification strategies were tested. 3 independent experiments were conducted. e. A representative gel image of libraries of PerturbSci. 5 independent experiments were conducted. f-g. Boxplots showing sgRNA UMI counts (f) and the cell number recovered (g) from different sgRNA primer concentrations (n = 230, 181, 149, 529, 512, 445, 299 cells from 100nM to 10uM groups for sgNTC cells, n = 499, 399, 246, 1237, 1215, 904, 537 cells from 100nM to 10uM groups for sgFto cells). h. Scatterplot showing the correlation between log2-transformed counts per million (CPM) profiled by PerturbSci and EasySci10 in the 3T3L1-CRISPRi cell line. i. Barplots showing effective knockdown in mouse 3T3-CRISPRi-sgFto cells and human HEK293-idCas9-sgIGF1R cells computationally assigned in the species-mixing experiment (Fig. 1d). j–l. Barplots showing the cell identities fraction (j), whole transcriptome (k) and sgRNA UMI counts (l) detected per cell in different fixation conditions (n = 1508, 1132, 1247, 1084 cells for conditions from the left to the right). Tukey’s tests after one-way ANOVA were performed. m-n. Dotplots showing the relative recovery rate (n = 4, mean ± SEM) of HEK293-idCas9 cells in different fixation conditions following HCl permeabilization (m) and chemical conversion (n). Dunnett’s test after one-way ANOVA was performed. o. Boxplot showing the effect of chemical conversion on whole transcriptome UMI counts under 4 °C PFA + BS3 fixation condition (n = 1988 cells in the control group, n = 4831 cells in the converted group). Two-sided Wilcoxon rank sum test was performed. p. Mapping statistics of reads from PerturbSci-Kinetics. q-r. Boxplots showing single-cell whole transcriptome UMI counts (q) and gene counts (r) under different sequencing depth (n = 500 cells in each subsampling group). Boxes in boxplots indicate the median and IQR with whiskers indicating 1.5× IQR.

