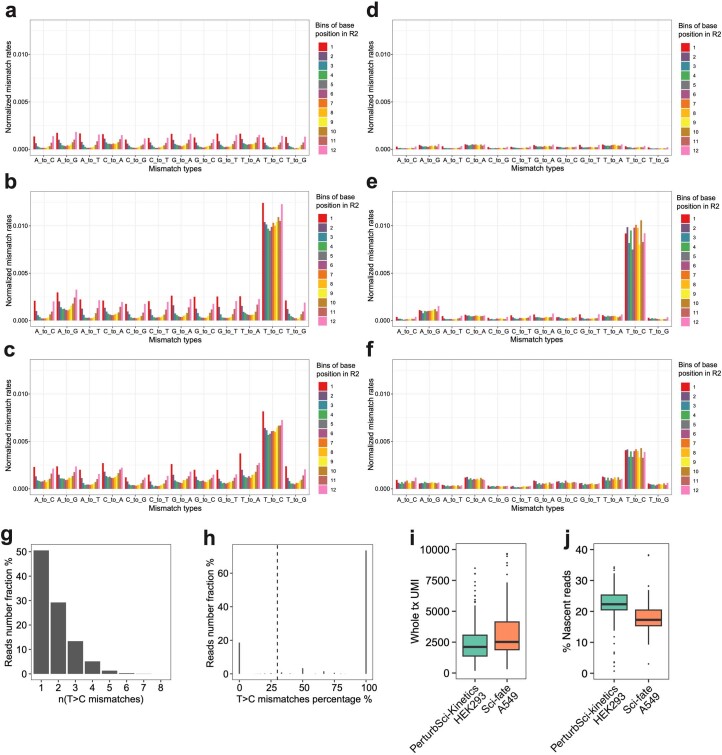
Extended Data Fig. 3. Optimization and benchmarking of the computational pipeline for nascent reads calling.
a–c. Barplots showing the normalized mismatch rates of all 12 mismatch types detected in unconverted cells (a), converted cells (b), and the original sci-fate A549 dataset20 (c) at different positions of the reads using the original sci-fate mutation calling pipeline20. d–f. Barplots showing the normalized mismatch rates of all 12 mismatch types detected in unconverted cells (d), converted cells (e), and the original sci-fate A549 dataset20 (f) at different positions of the reads using the updated mutation calling pipeline. Considering the different sequencing lengths between the present dataset and sci-fate, the Read2 from sci-fate were trimmed to the same length as the present dataset before processing. Compared to the original pipeline, the updated pipeline further filtered the mismatch based on the CIGAR string and only mismatches with ‘CIGAR = M’ were kept. Normalized mismatch rates in each bin, the percentage of each type of mismatch in all sequencing bases within the bin. g, h. Statistics of T > C mutations in PerturbSci-Kinetics reads. Histogram showing the number of T > C mutations on reads that were identified to be from newly synthesized transcripts (g). For each read with high-quality mismatches identified, the fraction of mismatches from T > C mutations was calculated, which clearly separated the reads with background mutations and mutants introduced by 4sU in the plot (h). 30% was set as the cutoff to assign nascent reads as sci-fate20. i, j. Downsampling comparison between sci-fate20 and PerturbSci-Kinetics. A subset of raw reads in sci-fate A549 dataset20 were randomly selected to generate a downsampled dataset with the same single-cell raw reads number distribution with PerturbSci-Kinetics, and both datasets were processed using the same pipeline (n = 200 cells for each dataset). The single-cell whole transcriptome UMI counts (i) and the nascent reads proportions (j) between two datasets were compared. Boxes in boxplots indicate the median and IQR with whiskers indicating 1.5× IQR.

