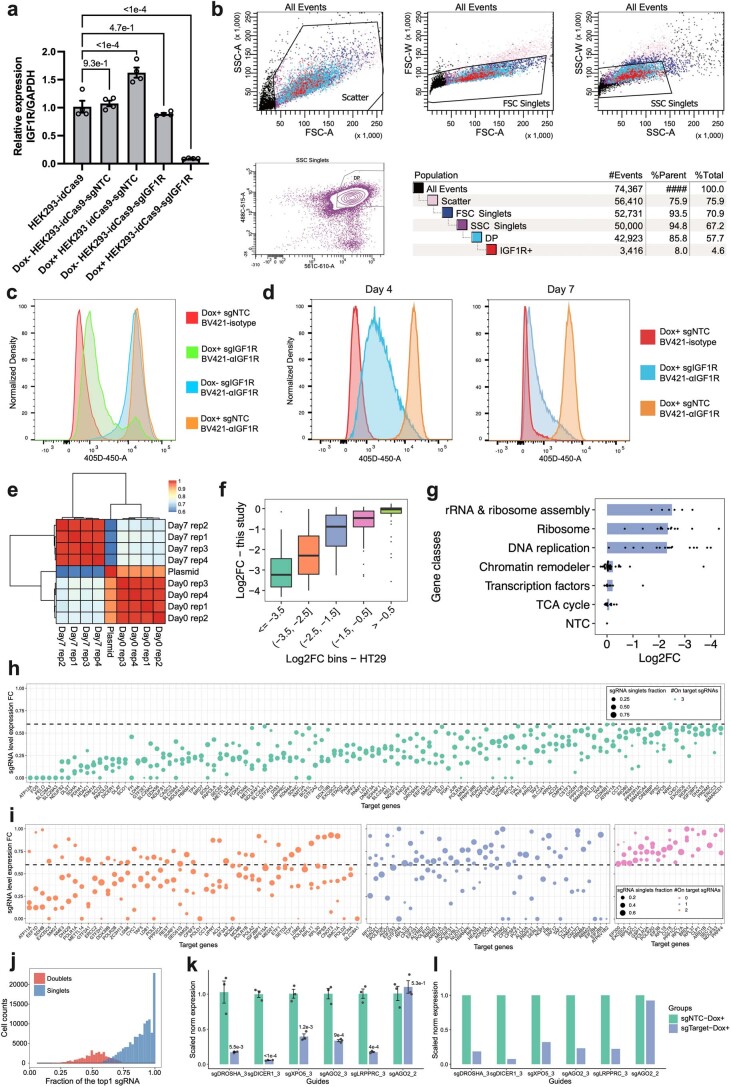
Extended Data Fig. 4. Validation of the performance of CRISPRi and quality control of bulk and single-cell PerturbSci-Kinetics libraries.
a–d. Inducible IGF1R mRNA and protein knockdown were further validated by RT-qPCR (a) after 3-day Dox induction (n = 4 biologically independent samples, data are presented as mean ± SEM. Dunnett’s test after one-way ANOVA was performed.) and by flow cytometry (b-d). The representative gating strategy for flow cytometry is shown in (b). Cells were treated with Dox+/Dox- media for 7 days before the flow-cytometry assay (c). To find the minimal time of Dox induction with stable knockdown, sgIGF1R and sgNTC cells were induced for either 4 days or 7 days and the IGF1R abundance was examined. Isotype, isotype control. αIGFIR, anti-IGF1R. e. Heatmap showing the Pearson correlations of normalized sgRNA read counts between the plasmid library and bulk screen replicates. f. Boxplot showing the reproducible trends of deletion upon CRISPRi between the present study and a prior report25 (n = 10, 57, 45, 49, 68 genes in each bin from left to right). g. Barplot showing the knockdown of genes with higher essentiality resulted in stronger cell growth arrest. h–i. Dotplots showing the expression fold changes of target genes upon CRISPRi induction compared to NTC in the single-cell PerturbSci-Kinetics dataset. Each dot represents a sgRNA. Fold change < 0.6 was used for sgRNA filtering, and genes with 3, 2, 1, 0 on-target sgRNA(s) were visualized in b-e, respectively. FC, fold change. j. Histogram showing the distribution of the fraction of the most abundant sgRNA in singlets (78%) and doublet cells (22%). k, l. The accuracy of sgRNA targeting efficiency in PerturbSci-Kinetics was further confirmed by RT-qPCR. Individual HEK293-idCas9 clones expressing 5 sgRNAs with high efficiency and 1 off-target sgRNA were established. RT-qPCR was conducted after 3-day Dox induction (n = 3 biologically independent samples). Data are presented as mean ± SEM, and two-sided Student′s t-test were performed (k). Mean expressions of target genes in NTC and corresponding cells in the original PerturbSci-Kinetics dataset were exhibited (l). Boxes in boxplots indicate the median and IQR with whiskers indicating 1.5 × IQR.

