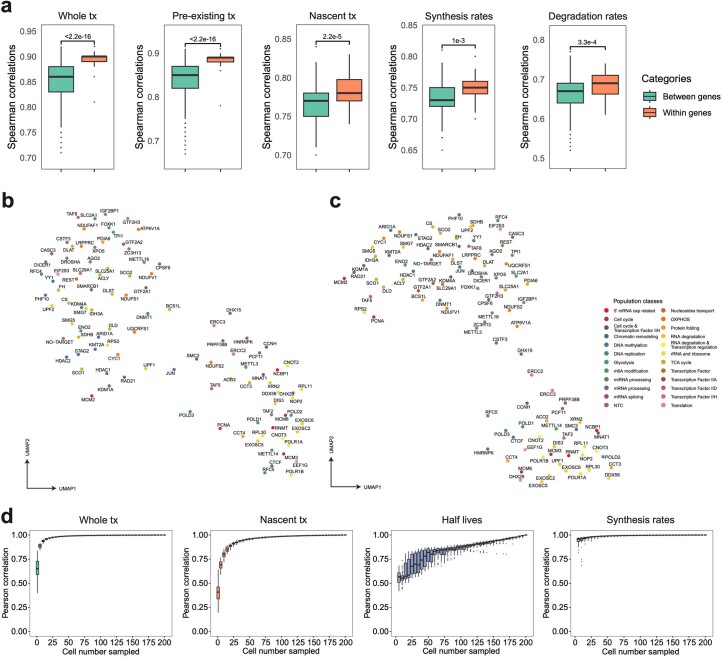
Extended Data Fig. 5. PerturbSci-Kinetics captures multi-layer transcriptome and RNA kinetics information upon perturbations with high fidelity.
a. Boxplots showing the pairwise correlation coefficients of sgRNAs targeting the same/different genes, computed using aggregated whole transcriptomes, pre-existing transcriptomes, nascent transcriptomes, gene-specific synthesis rates and degradation rates. Considering the data sparsity and different cell numbers across perturbations, 150 cells per sgRNA were assembled into one pseudobulk for downstream analysis. Spearman correlation coefficients were calculated using DEGs between perturbations and NTC in the pooled screen. Two-sided Welch′s t-tests were performed. b, c. UMAP of pseudobulk perturbations by inferred synthesis rates (b) and degradation rates (c). DEGs between all perturbations-NTC pairs were combined, and their synthesis and degradation rates were calculated for each perturbation. Only genes with calculable synthesis or degradation rate in at least 75% of pseudobulk perturbations were used for dimension reduction. The top 12 and 15 principal components from the synthesis and degradation rates matrix were used for UMAP visualization, respectively. These UMAPs showed meaningful patterns. For example, RNA exosome genes (for example, EXOSC2, EXOSC5, EXOSC6), nonsense-mediated mRNA decay pathway members (for example, SMG5, SMG7), ribosomal biogenesis genes (for example, NOP2, RPL30, RPL11, POLR1A, POLR1B), miRNA biogenesis pathway members (for example, DICER1, DROSHA, XPO5, and AGO2) were in relative proximity in both UMAPs. Chromatin remodelers (for example, HDAC1, HDAC2, STAG2, RAD21, KMT2A, KDM1A, ARID1A) were closely clustered in synthesis rates-derived UMAP, while m6A regulators (for example, METTL3, METTL16, ZC3H13, IGF2BP1) and polyadenylation factors (for example, CPSF6, CSTF3) were closer to each other in degradation rates-derived UMAP. d. Boxplots showing effects of cell number on the estimation of the pseudobulk whole/nascent transcriptome expression, gene-specific half-life, and synthesis rate. We conducted 50 random samplings for each cell number on sgDROSHA cells, then we aggregated profiles of sampled cells and retrieved pseudobulk expression levels and estimated RNA dynamics rates. We calculated the Pearson correlation coefficients between each downsampled pseudobulk group and unsampled pseudobulk sample. Boxes in boxplots indicate the median and IQR with whiskers indicating 1.5× IQR.

