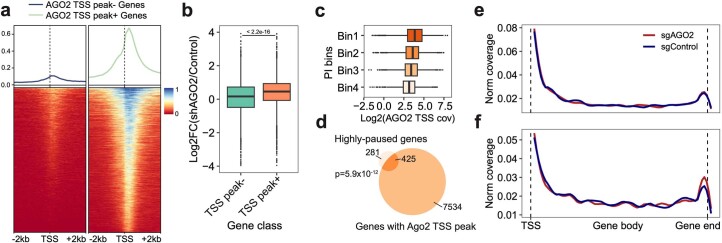
Extended Data Fig. 7. AGO2 functions as a transcriptional repressor by arresting transcription at the pausing status.
a. The density plot (top) and heatmap (bottom) show the density of AGO2 ChIP-seq reads around TSS of genes with or without enriched AGO2 TSS binding peaks. b. Boxplot showing the log2FC of gene expression between AGO2-silenced and control groups of genes with (n = 7315 genes) or without AGO2 TSS binding peaks (n = 3615 genes). Two-sided Wilcoxon rank sum test was performed. c. Boxplot displaying the positive correlation between PI of genes and normalized AGO2 ChIP-seq coverage within corresponding TSS regions. c, d. Genes were separated into 4 bins based on the average ranks of PI in two replicates (Methods). The Venn diagram highlights the significant association between AGO2 TSS binding and the strong pausing status of genes. One-sided Fisher′s Exact Test was conducted with the alternative hypothesis that the true odds ratio is greater than 1. Highly-paused genes, genes with top 10% of average PI ranks. e, f. Highly-paused genes were split into two groups, 1) significantly-upregulated genes upon AGO2 knockdown or 2) genes without significant expression changes. We then calculated the nascent RNA coverage of these two groups of genes in sgNTC and sgAGO2 cells. Notably, only genes in group 1 displayed increased 3′ end enrichment upon AGO2 knockdown (f). Boxes in boxplots indicate the median and IQR with whiskers indicating 1.5× IQR.

