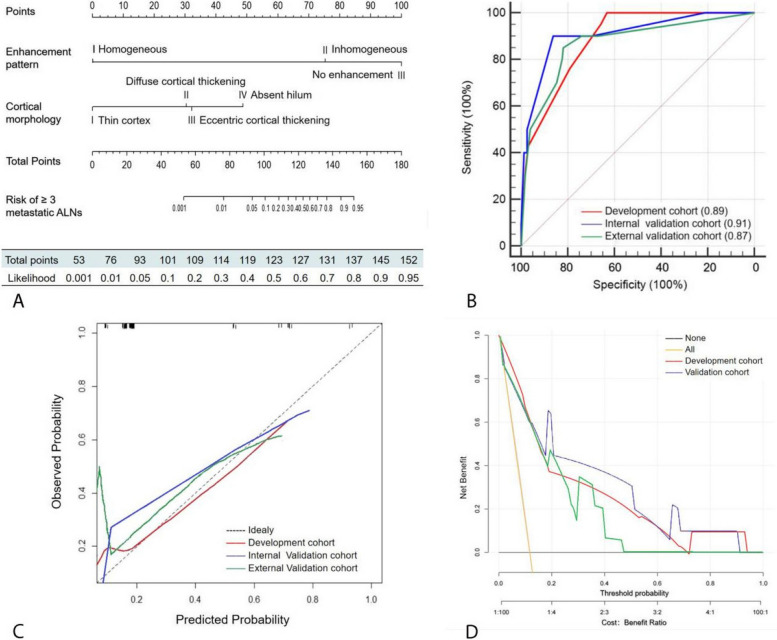
Fig. 4.
Development and validation of a nomogram to predict ≥ 3 metastatic ALNs. A Nomogram combining contrast-enhanced lymphatic US and grayscale US findings. Value assigned to each factor was scored on a scale of 0 to 100. By adding scores for each factor, one can obtain a total score. On the basis of the total score, the probability of having ≥ 3 metastatic ALNs is displayed by projecting the score to the bottom risk axis. B The receiver operating characteristic curve was obtained in the development (red line), the internal validation (blue line), and the external validation (green line) cohorts. C Calibration plot obtained in the development (red line), the internal validation (blue line), and the external validation (green line) cohorts. In calibration plots, a dotted line at a 45° angle represents perfect calibration. The nomogram-predicted probability of having ≥ 3 metastatic ALNs is plotted on the x-axis; the actual probability of having ≥ 3 metastatic ALNs is plotted on the y-axis. D Decision curves for having ≥ 3 metastatic ALNs in the development (red line), the internal validation (blue line), and the external validation (green line) cohorts. The yellow and black lines (horizontal) represent the scenarios where all or none of the women would be prospectively determined by the risk model, respectively. The decision lines demonstrate the net benefit of the risk model dependent at the chosen risk threshold for having ≥ 3 metastatic ALNs. ALN axillary lymph node

