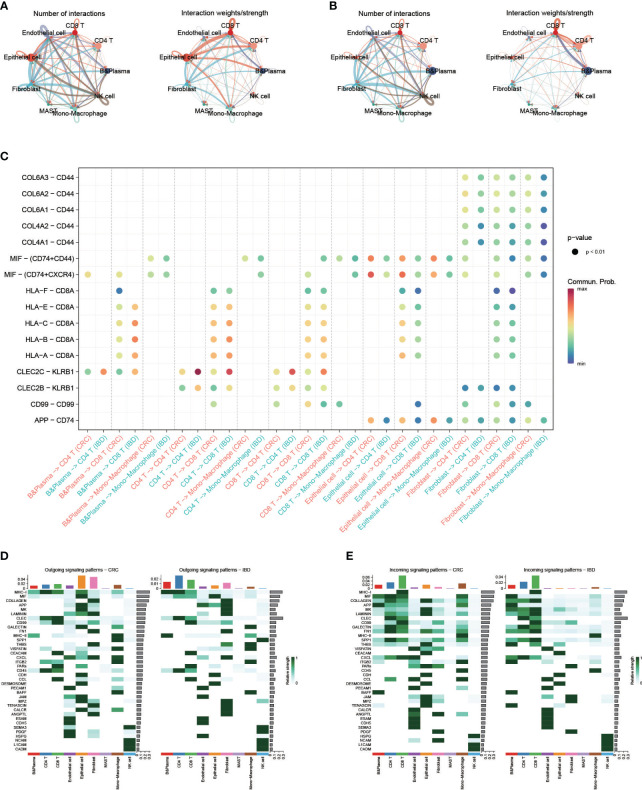
Figure 4.
Single-cell transcriptional analysis reveals the cell communication in CRC and IBD. (A) Analysis of the number of interactions and interaction strength between different cell types in CRC samples. (B) Analysis of the number of interactions and interaction strength between different cell types in IBD samples. (C) Identification of signaling by comparing the communication probabilities mediated by ligand-receptor pairs from macrophages to other cell types in CRC and IBD samples. (D, E) Overview of the outgoing signaling and incoming signaling in CRC and IBD samples.

