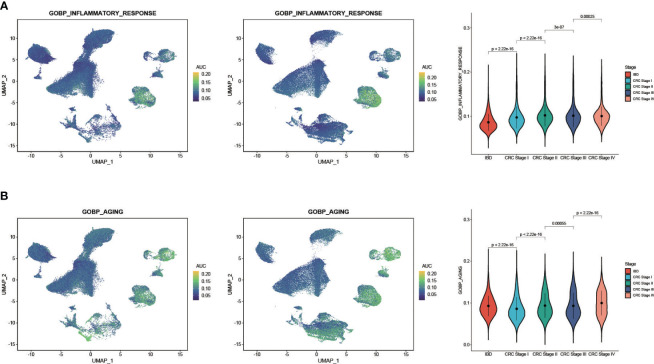
Figure 5.
AUCell analysis of the regulation of aging and inflammatory in CRC and IBD. (A) GOBP_AGING scored per cell by AUCell among nine cell subtypes. (B) GOBP_INFLAMMATORY_RESPONSE scored per cell by AUCell among nine cell subtypes. The yellow dots indicate a strong activity, whereas dark blue dots indicate a weak activity.

