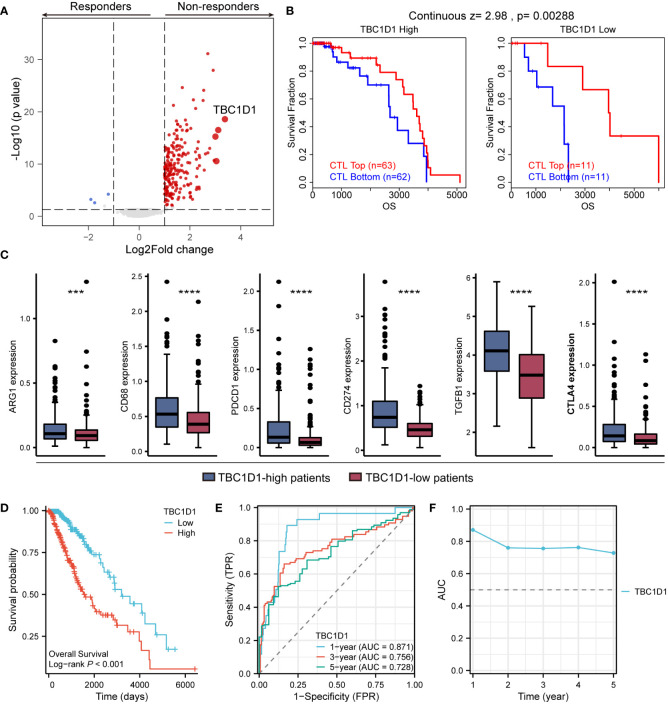
Figure 7.
Effect of TBC1D1 on treatment outcome and prognosis in glioma patients. (A) Volcano plot demonstrating differentially expressed genes in glioma treatment responders versus non-responders. (B) TBC1D1 affects survival of glioma patients by regulating CTL function. (C) Expression of immunosuppression-related genes, including ARG1, CD68, PDCD1, CD274, TGFB1, CTLA4, in tumors of patients with high- and low-TBC1D1 expression. (D) Effect of TBC1D1 on survival of glioma patients. (E) ROC curves to evaluate the predictive ability of TBC1D1 on survival time of patients. (F) AUC curves to evaluate the efficacy of TBC1D1 in predicting patient survival. P < 0.05 = “*”, P < 0.01 = “**”, P < 0.001 = “***”, P < 0.0001 = “****”, P > 0.05 = ns.

