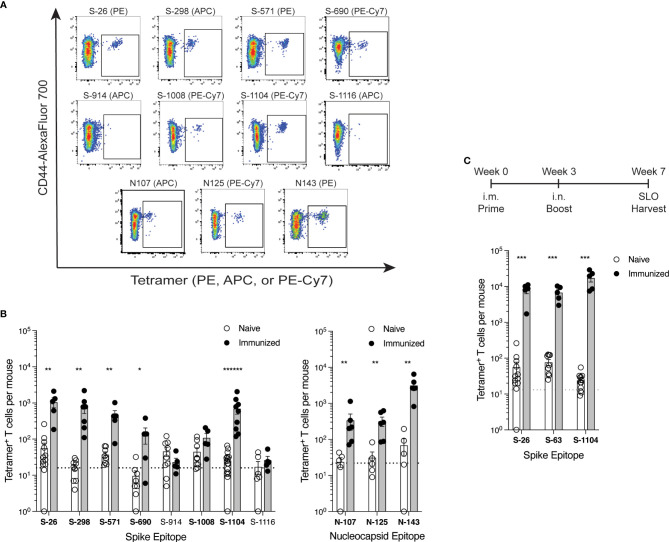
Figure 3.
Comparison of SARS-CoV-2 epitope-specific CD4+ T cell responses after protein immunization (A, B) C57BL/6 mice were immunized s.c. with spike or nucleocapsid protein plus CFA as adjuvant, and 7 days later, epitope-specific CD4+ T cells from the SLO were detected by tetramer-based cell enrichment and flow cytometry. (A) Representative flow cytometry plots of CD4+ gated events illustrating tetramer staining of epitope-specific T cells from protein-immunized mice. (B) Quantification of epitope-specific CD4+ T cells from naïve and immunized mice. Naive mice data is the same as in Figure 2C . Mean values ± SEM are shown for n=5-16 mice per epitope across multiple independent experiments. Bold font indicates epitopes validated by statistically significant increases in frequency upon immunization. (C) C57BL/6 mice were primed intramuscularly (i.m.) with Wuhan spike protein plus poly (I:C) as adjuvant, and 3 weeks later, boosted intranasally (i.n.) with the same dose. Four weeks later, epitope-specific memory CD4+ T cells from the SLO were enumerated by tetramer-based cell enrichment and flow cytometry. Naive data is the same as in Figure 2C and Supplementary Figure S2 . Mean values ± SEM are shown for n=5 mice per epitope. Dotted lines represent the limit of detection as defined by the mean numbers of CD8+tetramer+ events per mouse. Statistical significance was calculated via Mann-Whitney tests (B) and (C); *p < 0.05, **p < 0.01, ***p < 0.001, ******p < 0.000001.

