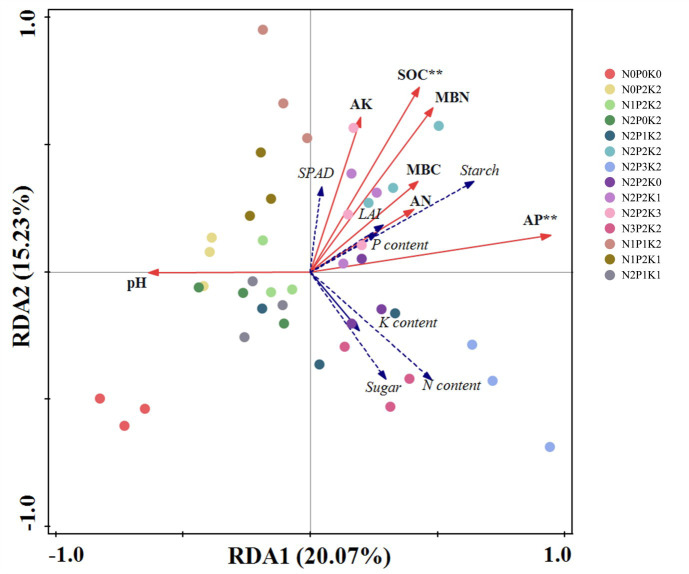
Figure 3.
Redundancy analysis (RDA) between soil properties and leaf physiological traits. Soil factors are indicated by solid arrows. Leaf properties are indicated by dashed lines. The first (horizontal) and second (vertical) axes explain 20.07% and 15.23% of the variation. ** means that correlation is significant at the 0.01 level.

