FIGURE 2.

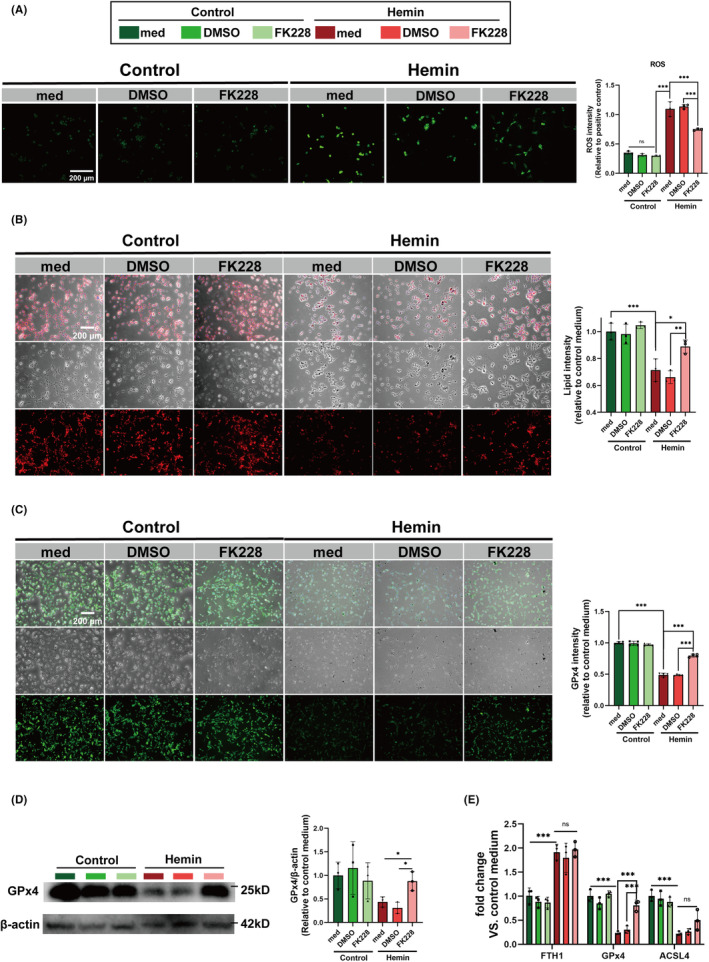
HDAC1/2 inhibition mitigates the neuronal ferroptosis by modulating microglial heterogenization in vitro ICH model. (A) ROS levels in HT22 cells treated with FK228 or vehicle (DMSO) after Hemin‐induced model (scale bar = 200 μm). (B) Representative images of lipid droplet staining in HT22 cells with varying treatments, providing insight into lipid metabolism changes post‐Hemin exposure (scale bar = 200 μm). (C) Representative images of immunofluorescence staining for GPx4 in HT22 cells (scale bar = 200 μm). (D) Western blotting analysis of GPx4 protein levels in HT22 cells. (E) The mRNA expression levels of FTH1, GPx4, ACSL4 as quantified by RT‐qPCR after treatment with Hemin and FK228. All the data are presented as the mean ± SD. One‐way ANOVA test and Bonferroni post hoc (A–E). n = 3 per group (A, D, E), n = 4 per group (B, C), *p < 0.05, **p < 0.01, ***p < 0.001, ns: no significance.
