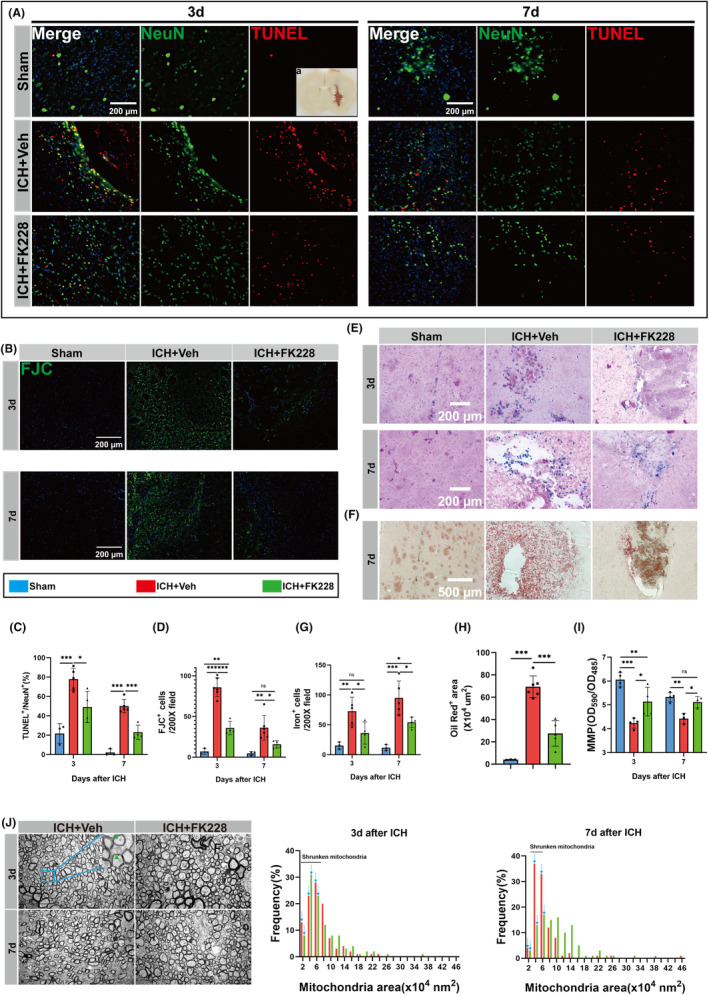
FIGURE 3.

HDAC1/2 inhibition reduces neuronal ferroptosis and degeneration in vivo ICH model. (A) Sampling location diagram. (A, C) TUNEL staining was used to mark apoptosis neurons at day 3 and 7 after ICH. Representative images and quantification are shown. n = 3 for Sham; n = 4 for ICH and Vehicle, n = 4 for ICH and FK228. (scale bar = 200 μm). (B, D) FJC staining at day 3 and 7 after ICH. Representative images and quantification are shown. n = 3 for Sham; n = 4 for ICH and Vehicle, n = 4 for ICH and FK228. (scale bar = 200 μm). (E, G) Representative image of Perls' staining and quantification of iron‐positive cells. n = 3 for Sham; n = 5 for ICH and Vehicle, n = 4 for ICH and FK228. (scale bar = 200 μm). (F, H) Representative image of Oil red O staining and quantification of Oil red O‐positive area. n = 3 for Sham; n = 5 for ICH and Vehicle, n = 4 for ICH and FK228. (scale bar = 500 μm). (I) Mitochondria membrane potential (MMP) of tissue around the hematoma at 3 and 7 days for mice after ICH. 3d, n = 4 for Sham; n = 4 for ICH and Vehicle, n = 4 for ICH and FK228; 7d, n = 4 for Sham; n = 3 for ICH and Vehicle, n = 3 for ICH and FK228. (J) Ultrastructure of neuron axons and quantification analysis of the mitochondrial area frequency in axons on the 3 and 7 days post‐ICH. n = 3 for ICH and Vehicle, n = 3 for ICH and FK228. Number of axon mitochondria, 3d, n = 194 for ICH and Vehicle, n = 181 for ICH and FK228 ICH and Vehicle; 7d, n = 134 for ICH and vehicle, n = 165 for ICH and FK228. Shrunken mitochondrial can be seen (green borrow). All the data are presented as the mean ± SD. One‐way ANOVA test and Bonferroni post hoc (C, D, G–I). *p < 0.05, **p < 0.01, ***p < 0.001, ns: no significance.
